


Using Graphics to Display Data - Business Decision Making - ثاني ثانوي
Part 1
Chapter1: Identifying and Defining Problems


Chapter2: Solving the Problem
Chapter3: Thinking Critically
Chapter4: Group Decision Making and Problem Solving
Chapter5: Decision Support Tools
Chapter 6: Decision-Making Processes in Organizations
Chapter 7: Managing Teams to Support Decisions in Organizations
Chapter 8: Organizational Communication and Decision Making
Part 2
Chapter 9: Using Data to Support the Decision-making Process
Chapter 10: Decision Support System Fundamentals
Chapter 11: Using Microsoft Excel Solver
Chapter 12: The Car Production Project
Chapter 13: The Ski Resort Project
Chapter 14: The Electric Car Project
Chapter 15: The Airline Project
Part 1
Chapter1: Identifying and Defining Problems
Chapter2: Solving the Problem
Chapter3: Thinking Critically
Chapter4: Group Decision Making and Problem Solving
Chapter5: Decision Support Tools
Chapter 6: Decision-Making Processes in Organizations
Chapter 7: Managing Teams to Support Decisions in Organizations
Chapter 8: Organizational Communication and Decision Making
Part 2
Chapter 9: Using Data to Support the Decision-making Process
Chapter 10: Decision Support System Fundamentals
Chapter 11: Using Microsoft Excel Solver
Chapter 12: The Car Production Project
Chapter 13: The Ski Resort Project
Chapter 14: The Electric Car Project
Chapter 15: The Airline Project
Lesson 6 Chapter 5 www.ien.edu.sa Using Graphics to Display Data By representing your data, decisions, and solutions graphically you can see trends, relationships, and results that would be hard to detect in a list of num- bers. Drawings, charts, and other illustrations also help make your case clearer and easier for others to understand. Software such as spreadsheets and presen- tation graphics programs provide tools to help you visualize and display data. Table 5-4 lists the do's and don'ts for displaying data graphically. case Before Omar makes a presentation to the other company managers about expanding services to corporate customers, he asks you to create charts to display data graphically. TABLE 5-4: Using graphics do's and don'ts Guidelines Do Bar chart Line chart Area chart Pie chart • Use bars to represent data, with the length of the bar corresponding to the size of the data • Plot a series of points and then connect them with a line to show directions or trends in the data over time . Scatter plot . Display values for each variable as cumulative totals using numbers or percentages • Use different colors or fill patterns to differentiate each layer • Choose an area chart to represent the volume of data •Compare the percentage of an element with the whole • Use pie charts to compare data at one point in time Display two variables for a set of data • Show correlations among variables, especially nonlinear ones Don't • Don't use long text on the horizontal axis • Don't plot too many points or you might not be able to see the pattern Don't hide the area you want to emphasize in the middle of the chart-place it along the baseline • Don't use if you are making a comparison between multiple series-consider using a bar chart instead • Don't use if you are analyzing trends over a period time-consider using a line chart instead • Don't use pie charts to show changes over time • Don't compare sectors across multiple pie charts • Don't create pie charts with many small slices • Don't plot more than two variables • Don't interpret a scatter plot the same way as a line chart because a scatter plot combines two values in one point QUICK TIP Bar charts with vertical bars are called column charts. Essential Elements 1. Bar charts A bar chart uses rectangular bars to display data values. The length of each bar represents a value. The longer the bar, the greater the value. Bar charts can be oriented horizontally or vertically. Simple charts use one set of bars to represent a single variables or point in time. Multiple variables or points in time may be represented by several adjacent bars. See Figure 5-10a. وزارة التعليم Ministry of Education 2024-1446 95198_book_PP1.indb 143 Decision Support Tools 143 07/05/2024 10:57

Using Graphics to Display Data
Using graphics do’s and don’ts
Bar charts
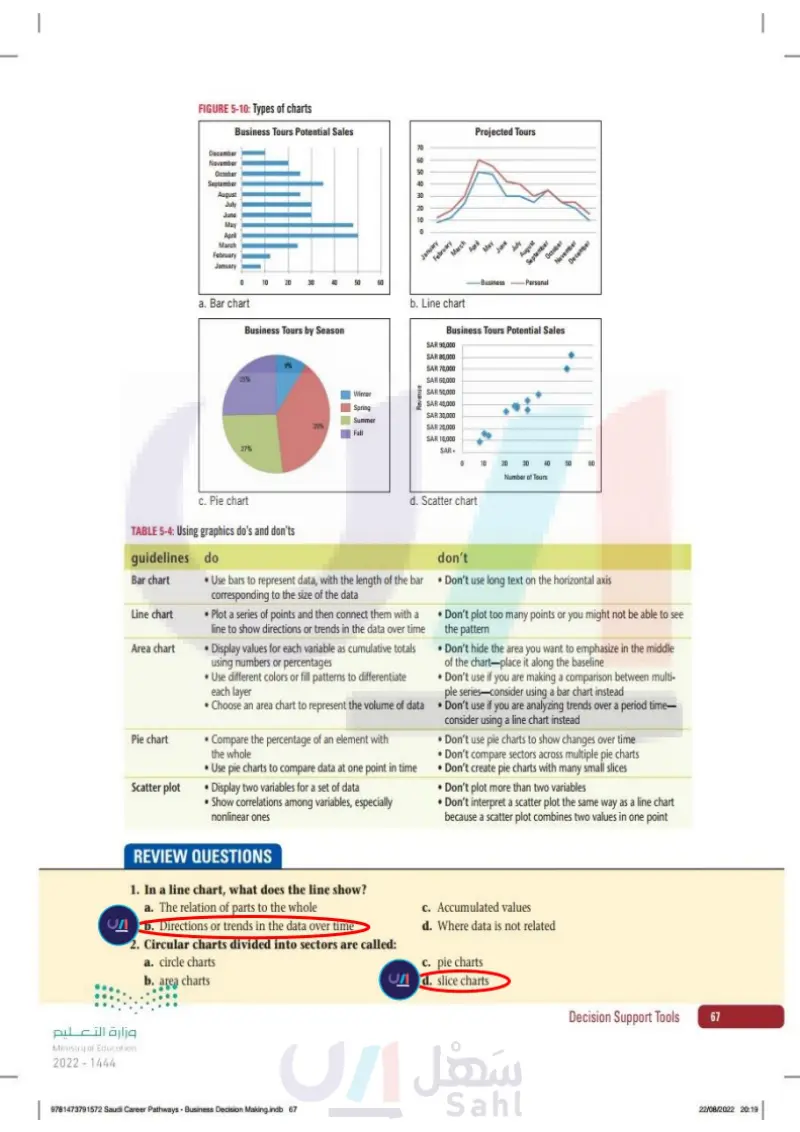
144 5 Chapter رة ا Ministry of Education 2024-1446 Business Decision Making S1 S2 S3.indb 144 FIGURE 5-10: Types of charts December November Business Tours Potential Sales October September August July June May April March February January 0 10 20 30 40 50 a. Bar chart Business Tours by Season 9% 25% 27% c. Pie chart Winter Spring Summer 39% Fall 60 60 Projected Tours 70 10 2623200 50 40 January February March April May June July Business August September Personal October November December b. Line chart Business Tours Potential Sales SAR 90,000 Revenue SAR 80,000 SAR 70,000 SAR 60,000 SAR 50,000 SAR 40,000 SAR 30,000 SAR 20,000 SAR 10,000 SAR - 0 10 20 30 40 Number of Tours d. Scatter chart 50 50 60 2. Line charts To create a line chart, you plot a series of points and then connect them with a line. Each point represents a measurement or value. The line shows direc- tions or trends in the data over time. See Figure 5-10b. 3. Area charts An area chart is similar to a line chart because it compares two or more vari- ables over time. However, it displays the values for each variable as cumula- tive totals using numbers or percentages. This means that each variable is layered one on top of another. A color or fill pattern highlights each variable. 4. Pie charts Pie charts are circles divided into sectors, with each sector resembling a slice of a pie. See Figure 5-10c. The size of the slice represents the relative size or frequency of the corresponding variable. Because the entire chart forms a complete circle, it shows the percentage of the whole that each variable rep- resents. Use pie charts to compare data at one point in time, usually to the whole. Pie charts are easiest to interpret when the largest slice represents at least 25-30% of the data. Ideally, a pie chart should emphasize a single vari- able and compare that slice with the rest of the pie. 30/06/2023 14:28

Types of charts
Line charts
Area charts
Pie charts
QUICK TIP Most software tools can display 3D scatter plots with up to four dimensions. YOU TRY IT 5. Scatter plots Scatter plots display two variables for a set of data. You plot the data for one variable along the horizontal axis and the other variable on the vertical axis. A scatter plot shows correlations between variables, especially nonlinear ones. If the points appear random and unordered, the two variables do not have a strong relationship. See Figure 5-10d. Research Web sites that use graphics to display data. Complete the following steps. 1. Get ready 1. Open a Web browser such as Internet Explorer or Firefox, and go to the following site: Saudi Vision 2030: www.vision2030.gov.sa 2. Explore the Web site and find examples of graphics that display data. 3. Take three screenshots of examples. 2. Now you try it Using a word processor, paste the screenshots of your results into a new doc- ument, describing how the examples succeed in presenting the information. Alternatively, describe your results in your notebook. وزارة التعليم Ministry of Education 2024-1446 Business Decision Making S1 S2 S3.indb 145 Decision Support Tools 145 30/06/2023 14:28

Scatter plots
Research Web sites that use graphics to display data. Complete the following steps Get ready
Using a word processor, paste the screenshots of your results into a new doc-ument, describing how the examples succeed in presenting the information
REVIEW QUESTIONS 146 5 Chapter رة ا Ministry of Education 2024-1446 Business Decision Making S1 S2 S3.indb 146 1. In a line chart, what does the line show? a. The relation of parts to the whole b. Directions or trends in the data over time c. Accumulated values d. Where data is not related 2. Circular charts divided into sectors are called: a. circle charts b. area charts c. pie charts d. slice charts 30/06/2023 14:28

In a line chart, what does the line show?
Circular charts divided into sectors are called: