Creating Decision Trees - Business Decision Making - ثاني ثانوي
Part 1
Chapter1: Identifying and Defining Problems
Chapter2: Solving the Problem
Chapter3: Thinking Critically
Chapter4: Group Decision Making and Problem Solving
Chapter5: Decision Support Tools
Chapter 6: Decision-Making Processes in Organizations
Chapter 7: Managing Teams to Support Decisions in Organizations
Chapter 8: Organizational Communication and Decision Making
Part 2
Chapter 9: Using Data to Support the Decision-making Process
Chapter 10: Decision Support System Fundamentals
Chapter 12: The Car Production Project
Chapter 13: The Ski Resort Project
Chapter 14: The Electric Car Project
Chapter 15: The Airline Project
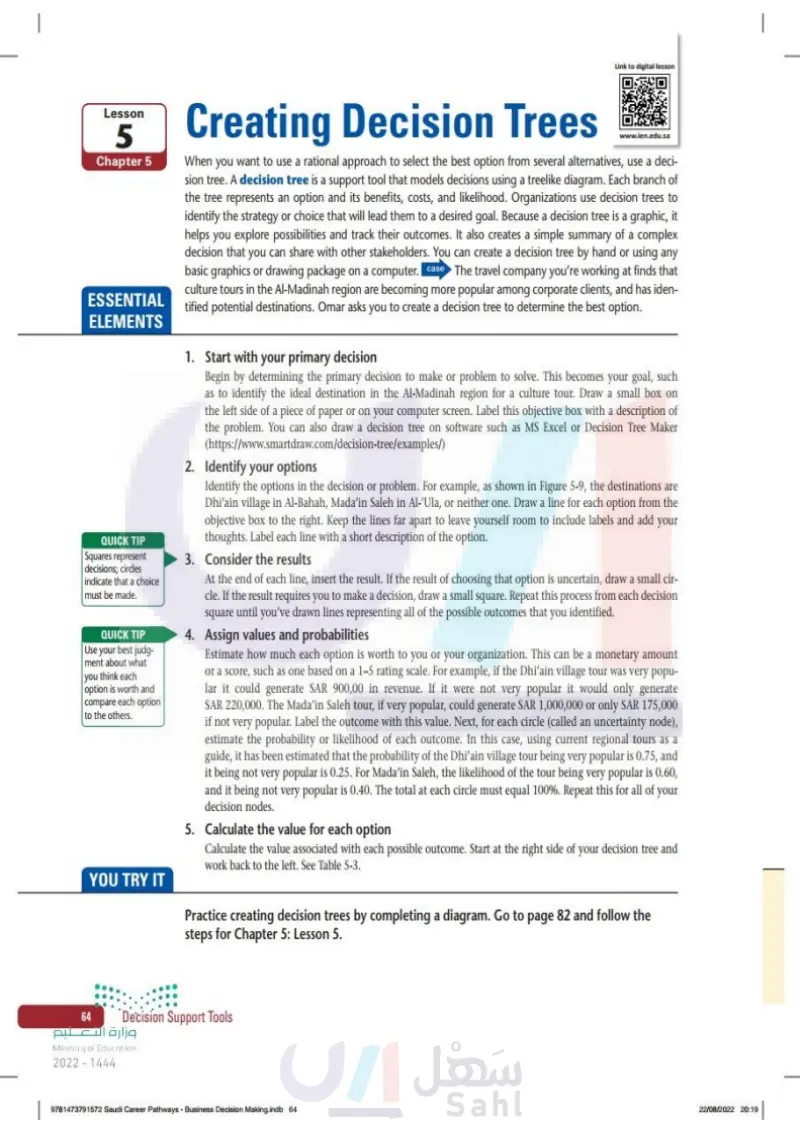
Lesson 5 Chapter 5 www.ien.edu.sa Creating Decision Trees When you want to use a rational approach to select the best option from several alternatives, use a decision tree. A decision tree is a support tool that models decisions using a treelike diagram. Each branch of the tree represents an option and its benefits, costs, and likelihood. Organizations use decision trees to iden- tify the strategy or choice that will lead them to a desired goal. Because a deci- sion tree is a graphic, it helps you explore possibilities and track their outcomes. It also creates a simple summary of a complex decision that you can share with other stakeholders. You can create a decision tree by hand or using any basic graphics or drawing package on a computer. case The travel company you're working at finds that culture tours in the Al-Madinah region are becoming more popular among corporate clients, and has identified potential destinations. Omar asks you to create a decision tree to determine the best option. وزارة التعليم Ministry of Education 2024-1446 95198_book_PP1.indb 139 DEFINITION Decision tree: A support tool that models decisions using a tree-like diagram. Each branch of the tree represents a different option and its associated benefits, costs, and likelihood. Essential Elements 1. Start with your primary decision Begin by determining the primary decision to make or problem to solve. This becomes your goal, such as to identify the ideal destination in the Al-Madinah region for a culture tour. Draw a small box on the left side of a piece of paper or on your computer screen. Label this objective box with a description of the problem. You can also draw a decision tree on software such as MS Excel or Decision Tree Maker (https://www.smartdraw.com/decision-tree/examples/) 2. Identify your options Identify the options in the decision or problem. For example, as shown in Figure 5-9, the destinations are Dhi'ain village in Al-Bahah, Mada'in Saleh in Al-'Ula, or neither one. Draw a line for each option from the objective box to the right. Keep the lines far apart to leave yourself room to include labels and add your thoughts. Label each line with a short description of the option. Decision Support Tools 139 07/05/2024 10:57

Creating Decision Trees
Start with your primary decision
Identify your options
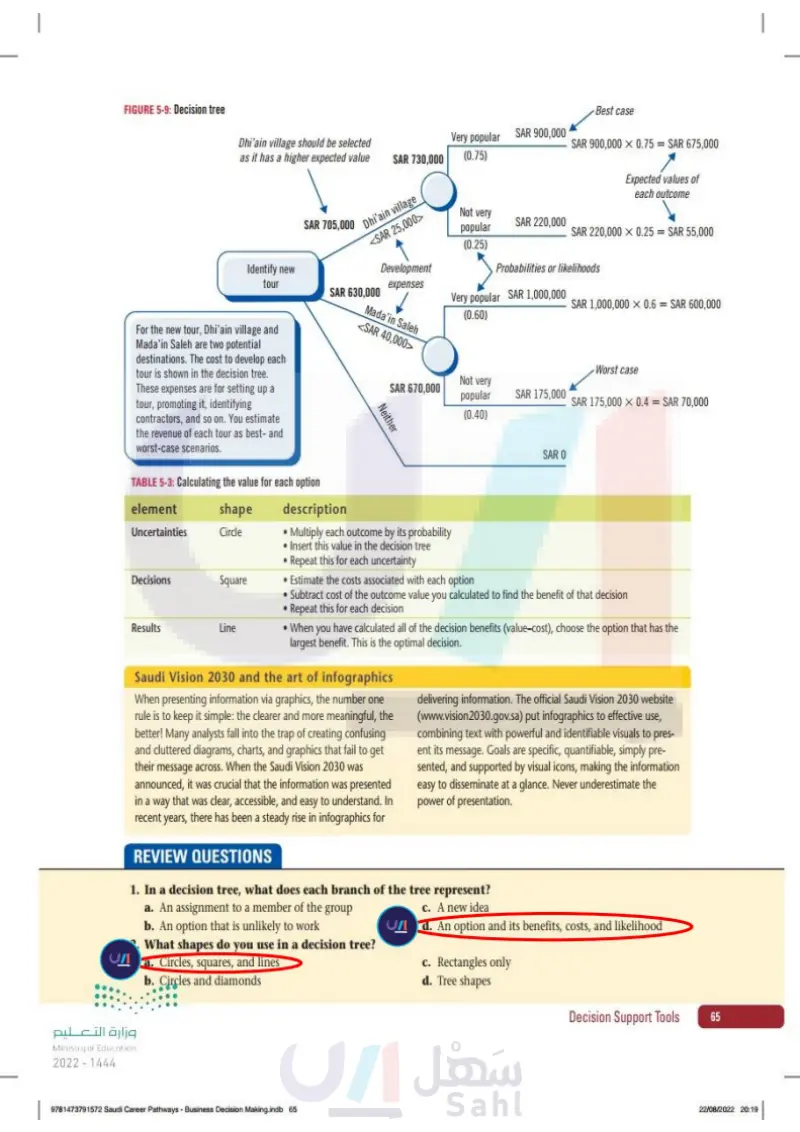
FIGURE 5-9: Decision tree Dhi'ain village should be selected as it has a higher expected value SAR 730,000 Very popular (0.75) SAR 900,000 Identify new tour For the new tour, Dhi'ain village and Mada'in Saleh are two potential destinations. The cost to develop each tour is shown in the decision tree. These expenses are for setting up a tour, promoting it, identifying contractors, and so on. You estimate the revenue of each tour as best- and worst-case scenarios. SAR 705,000 phi'ain village <SAR 25,000> SAR 630,000 Development expenses Mada'in Saleh <SAR 40,000> Neither Best case SAR 900,000 0.75 = SAR 675,000 Expected values of each outcome Not very popular (0.25) SAR 220,000 SAR 220,000 0.25 = SAR 55,000 Probabilities or likelihoods Very popular SAR 1,000,000 (0.60) SAR 1,000,000 × 0.6 = SAR 600,000 Worst case SAR 670,000 Not very popular (0.40) SAR 175,000 SAR 175,000 × 0.4 = SAR 70,000 SAR 0 QUICK TIP Squares represent decisions; circles indicate that a choice must be made. QUICK TIP Use your best judgment about what you think each option is worth and compare each option to the others. 3. Consider the results At the end of each line, insert the result. If the result of choosing that option is uncertain, draw a small circle. If the result requires you to make a decision, draw a small square. Repeat this process from each decision square until you've drawn lines representing all of the possible outcomes that you identified. 4. Assign values and probabilities Estimate how much each option is worth to you or your organization. This can be a monetary amount or a score, such as one based on a 1-5 rating scale. For example, if the Dhi'ain village tour was very popular it could gen- erate SAR 900,00 in revenue. If it were not very popular it would only gener- ate SAR 220,000. The Mada'in Saleh tour, if very popular, could generate SAR 1,000,000 or only SAR 175,000 if not very popular. Label the outcome with this value. Next, for each circle (called an uncertainty node), estimate the probability or likelihood of each outcome. In this case, using current regional tours as a guide, it has been estimated that the probability of the Dhi'ain village tour being very popular is 0.75, and it being not very popular is 0.25. For Mada'in Saleh, the likelihood of the tour being very popular is 0.60, and it being not very popular is 0.40. The total at each circle must equal 100%. Repeat this for all of your decision nodes. 140 5 Chapter رة ا Ministry of Education 2024-1446 Business Decision Making S1 S2 S3.indb 140 30/06/2023 14:28

Decision tree
Consider the results
Assign values and probabilities
5. Calculate the value for each option Calculate the value associated with each possible outcome. Start at the right side of your decision tree and work back to the left. See Table 5-3. TABLE 5-3: Calculating the value for each option Element Shape Uncertainties Circle Description • Multiply each outcome by its probability • Insert this value in the decision tree Repeat this for each uncertainty Decisions Square • Estimate the costs associated with each option Results Line • Subtract cost of the outcome value you calculated to find the benefit of that decision •Repeat this for each decision. • When you have calculated all of the decision benefits (value-cost), choose the option that has the largest benefit. This is the optimal decision. Saudi Vision 2030 and the art of infographics When presenting information via graphics, the number one rule is to keep it simple: the clearer and more meaningful, the better! Many analysts fall into the trap of creating confusing and cluttered diagrams, charts, and graphics that fail to get their message across. When the Saudi Vision 2030 was announced, it was crucial that the information was presented in a way that was clear, accessible, and easy to understand. In recent years, there has been a steady rise in infographics for delivering information. The official Saudi Vision 2030 website (www.vision 2030.gov.sa) put infographics to effective use, combining text with powerful and identifiable visuals to present its message. Goals are specific, quantifiable, simply presented, and supported by visual icons, making the information easy to disseminate at a glance. Never underestimate the power of presentation. YOU TRY IT وزارة التعليم Ministry of Education 2024-1446 Business Decision Making S1 S2 S3.indb 141 Practice creating decision trees by completing a diagram. Complete the follow- ing steps. 1. Get ready The travel company you're working at is considering whether to organize an event for business travelers to promote the popular Riyadh city tour. The event would take place at King Abdullah Park in Riyadh. The company would serve food from under a large canopy, but otherwise the event would take place out in the open. Depending on the weather forecast, the company could also hold the event in a nearby event hall. Below the diagram is a description of the decisions in the decision tree. Decision Support Tools 141 30/06/2023 14:28

Calculate the value for each option
Saudi Vision 2030 and the art of infographics
Practice creating decision trees by completing a diagram. Complete the following steps Get ready
Should the company hold the event for business travelers outdoors or indoors? What is the weather forecast? Sunny Overcast Outdoors: Indoors: 7 3 Outdoors: 9 Indoors: Rain Possible Outdoors: 1 Indoors: 28 2 8 How humid will it be? 70% or less More than 70% Outdoors: 7 Outdoors: Indoors: 3 Indoors: 28 Will it also be windy? Yes No Outdoors: 0 Indoors: 10 Outdoors: Indoors: 28 2 8 According to the diagram: If the weather is sunny, 7 people say the event should be outdoors and 3 people say it should be indoors (perhaps because it is too hot). • If the humidity is over 70%, however, only 2 people say the event should be outdoors and 8 people say it should be indoors. If the humidity is 70% or less, 7 people still say the event should be out- doors and 3 people say it should be indoors. 2. Now you try it REVIEW QUESTIONS Complete the description of the diagram to help the company make its decision. Considering all of the factors and decisions in the decision tree, should the company hold the event for business travelers indoors or outdoors? 1. In a decision tree, what does each branch of the tree represent? a. An assignment to a member of the group b. An option that is unlikely to work c. A new idea d. An option and its benefits, costs, and likelihood 2. What shapes do you use in a decision tree? a. Circles, squares, and lines b. Circles and diamonds c. Rectangles only d. Tree shapes 142 5 Chapter رة ا Ministry of Education 2024-1446 Business Decision Making S1 S2 S3.indb 142 30/06/2023 14:28

Should the company hold the event for business travelers outdoors or indoors?
Complete the description of the diagram to help the company make its decision
In a decision tree, what does each branch of the tree represent
What shapes do you use in a decision tree


