Describing Data Objectively - Business Decision Making - ثاني ثانوي
Part 1
Chapter1: Identifying and Defining Problems
Chapter2: Solving the Problem
Chapter3: Thinking Critically
Chapter4: Group Decision Making and Problem Solving
Chapter5: Decision Support Tools
Part 2
Chapter 6: Decision-Making Processes in Organizations
Chapter 7: Managing Teams to Support Decisions in Organizations
Chapter 8: Organizational Communication and Decision Making
Chapter 9: Using Data to Support the Decision-making Process
Part 3
Chapter 10: Decision Support System Fundamentals
Chapter 12: The Car Production Project
Chapter 13: The Ski Resort Project
Chapter 14: The Electric Car Project
Chapter 15: The Airline Project
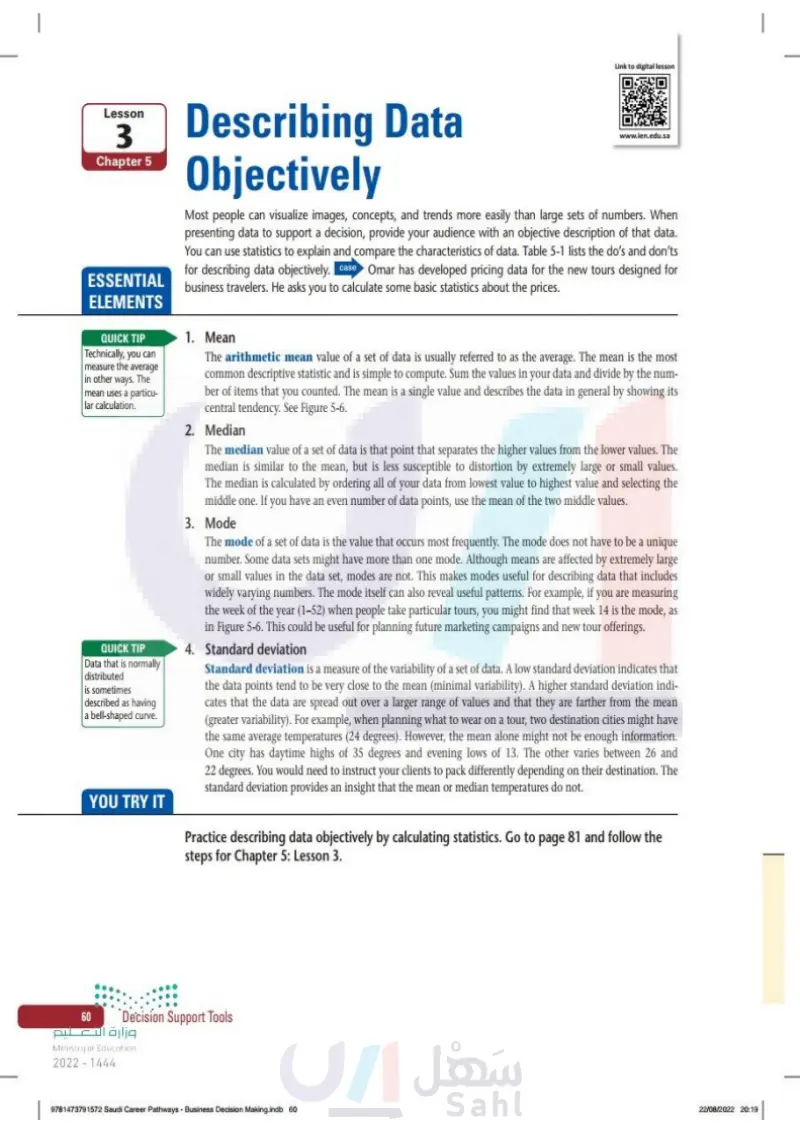
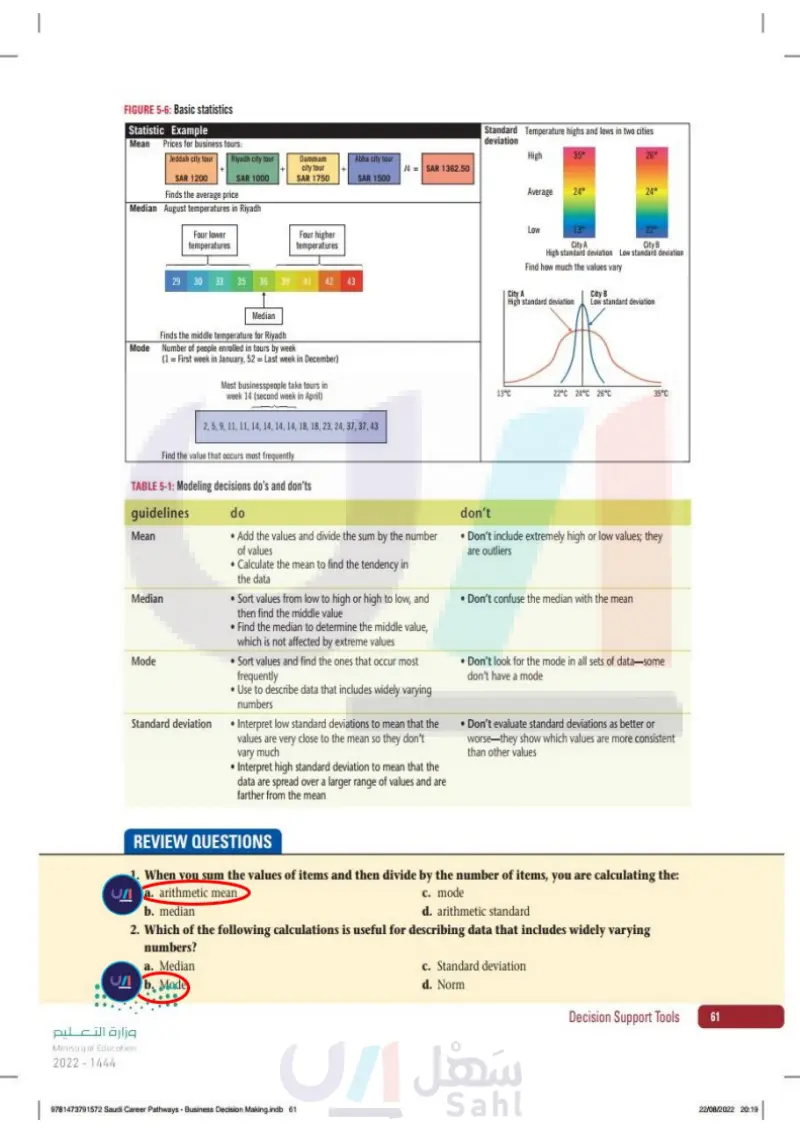
Lesson 3 Chapter 5 www.ien.edu.sa Describing Data Objectively Most people can visualize images, concepts, and trends more easily than large sets of numbers. When presenting data to support a decision, provide your audi- ence with an objective description of that data. You can use statistics to explain and compare the characteristics of data. Table 5-1 lists the do's and don'ts for describing data objectively. case Omar has developed pricing data for the new tours designed for business travelers. He asks you to calculate some basic statis- tics about the prices. TABLE 5-1: Modeling decisions do's and don'ts Guidelines Mean Median Mode Standard deviation Do •Add the values and divide the sum by the number of values •Calculate the mean to find the tendency in the data • Sort values from low to high or high to low, and then find the middle value • Find the median to determine the middle value, which is not affected by extreme values • Sort values and find the ones that occur most frequently Use to describe data that includes widely varying numbers • Interpret low standard deviations to mean that the values are very close to the mean so they don't . vary much Interpret high standard deviation to mean that the data are spread over a larger range of values and are farther from the mean Don't • Don't include extremely high or low values; they are outliers • Don't confuse the median with the mean • Don't look for the mode in all sets of data- some don't have a mode • Don't evaluate standard deviations as better or worse they show which values are more consistent than other values QUICK TIP Technically, you can measure the average in other ways. The mean uses a particular calculation. Essential Elements 1. Mean The arithmetic mean value of a set of data is usually referred to as the aver- age. The mean is the most common descriptive statistic and is simple to compute. Sum the values in your data and divide by the number of items that you counted. The mean is a single value and describes the data in gen- eral by showing its central tendency. See Figure 5-6. وزارة التعليم Ministry of Education 2024-1446 95198_book_PP1.indb 131 Decision Support Tools 131 07/05/2024 10:57

Describing Data Objectively
TABLE 5-1: Modeling decisions do’s and don’ts
Mean
FIGURE 5-6: Basic statistics Statistic Example Mean Prices for business tours: Jeddah city tour DEFINITION Arithmetic mean: The value of a set of data that is usually referred to as the average. The mean is a single value and describes the data in general by showing its central tendency. Riyadh city tour + + Dammam city tour Abha city tour + /4 = SAR 1362.50 SAR 1200 SAR 1000 SAR 1750 SAR 1500 Finds the average price Median August temperatures in Riyadh Four lower temperatures Four higher temperatures 29 29 30 33 35 36 39 41 42 43 233 Median Mode Finds the middle temperature for Riyadh Number of people enrolled in tours by week (1 = First week in January, 52 = Last week in December) Most businesspeople take tours in week 14 (second week in April) 2, 5, 9, 11, 11, 14, 14, 14, 14, 18, 18, 23, 24, 37, 37, 43 Find the value that occurs most frequently 132 5 Chapter رة ا Ministry of Education 2024-1446 Business Decision Making S1 S2 S3.indb 132 Standard Temperature highs and lows in two cities deviation High 35° 26° Average 24° 24° Low 13° City A 22° City B High standard deviation Low standard deviation Find how much the values vary City A City B High standard deviation Low standard deviation 13°C 22°C 24°C 26°C 35°C 2. Median The median value of a set of data is that point that separates the higher val- ues from the lower values. The median is similar to the mean, but is less susceptible to distortion by extremely large or small values. The median is calculated by ordering all of your data from lowest value to highest value and selecting the middle one. If you have an even number of data points, use the mean of the two middle values. DEFINITION Median: The value of a set of data that separates the higher values from the lower values. 3. Mode The mode of a set of data is the value that occurs most frequently. The mode does not have to be a unique number. Some data sets might have more than 30/06/2023 14:28

Arithmetic mean
FIGURE 5-6: Basic statistics
Median
Mode
one mode. Although means are affected by extremely large or small values in the data set, modes are not. This makes modes useful for describing data that includes widely varying numbers. The mode itself can also reveal useful patterns. For example, if you are measuring the week of the year (1-52) when people take particular tours, you might find that week 14 is the mode, as in Figure 5-6. This could be useful for planning future marketing cam- paigns and new tour offerings. DEFINITION Mode: The value in a set of data that occurs most frequently. The mode does not have to be a unique number. QUICK TIP Data that is normally distributed is sometimes described as having a bell- shaped curve. 4. Standard deviation Standard deviation is a measure of the variability of a set of data. A low standard deviation indicates that the data points tend to be very close to the mean (minimal variability). A higher standard deviation indicates that the data are spread out over a larger range of values and that they are farther from the mean (greater variability). For example, when planning what to wear on a tour, two destination cities might have the same average tempera- tures (24 degrees). However, the mean alone might not be enough informa- tion. One city has daytime highs of 35 degrees and evening lows of 13. The other varies between 26 and 22 degrees. You would need to instruct your clients to pack differently depending on their destination. The standard devi- ation provides an insight that the mean or median temperatures do not. DEFINITION Standard deviation: A measure of the variability of a set of data. YOU TRY IT Practice describing data objectively by calculating statistics. Complete the fol- lowing steps. 1. Get ready Review the following statistics for business tours: 1. Jeddah city tour 2. Riyadh city tour 3. Dammam city tour 4. Abha city tour وزارة التعليم Ministry of Education 2024-1446 Business Decision Making S1 S2 S3.indb 133 Decision Support Tools 133 30/06/2023 14:28

one mode
Standard deviation
Practice describing data objectively by calculating statistics. Complete the following steps Get ready
Month Top Tour January 2 February 4 March 2 April 3 May 2 June 1 July 3 August 1 September 2 October 2 November 4 December 2 2. Now you try it REVIEW QUESTIONS Decide on the most popular tour for business travelers. 1. When you sum the values of items and then divide by the num- ber of items, you are calculating the: a. arithmetic mean b. median c. mode d. arithmetic standard 2. Which of the following calculations is useful for describing data that includes widely varying numbers? a. Median b. Mode c. Standard deviation d. Norm 134 5 Chapter رة ا Ministry of Education 2024-1446 Business Decision Making S1 S2 S3.indb 134 30/06/2023 14:28

Now you try it Decide on the most popular tour for business travelers.
. When you sum the values of items and then divide by the number of items, you are calculating the:
Which of the following calculations is useful for describing data that includes widely varying numbers?


