Optimization - Data Science - ثاني ثانوي
1. Introduction to Data Science
3. Exploratory Data Analysis
4. Predictive data modeling and forecasting
Lesson 3 Optimization Link to digital lesson www.ien.edu.sa Dealing with Optimization Problems Optimization problems are real-world problems that arise in many areas such as mathematics, engineering, science, business and economics. In these problems, we are trying to find a way (the optimal or the most efficient way) of using limited resources to achieve an objective in a given situation. Our objective might be maximizing profit, minimizing cost, minimizing the total distance traveled or minimizing the total time to complete a project. In other cases, it might be maximizing tourist visits in a country, choosing the optimal budget for an advertising campaign, designing the best work schedule for employees, minimizing delivery costs, and so on. Optimization The process of choosing the best element from a set of available alternatives under some constraints. What is Excel Solver? Microsoft Excel Solver is an add-in program, used for the simulation and optimization of various business and engineering models. It belongs to a special set of Excel commands often referred to as "What-If Analysis tools", and is used for finding the best solutions for a model that consists of multiple inputs. The most common use of Excel Solver is to determine a value for one cell (called the objective cell) by changing the values in certain other cells (called variable cells), with or without the use of constraints. It is useful for solving linear programming problems (also known as linear optimization problems) and therefore is sometimes called the Linear Programming Solver. Excel Solver is a powerful tool for dealing with optimization problems, because we can use spreadsheets to insert the decision variables and the constraints of a model, and execute the objective function that describes it. When a model has two decision variables, graphical methods can be used to solve the model. Very few real world problems involve only two variables. For problems with more than two variables, we need to use complex techniques and calculations to find the optimal solution. The spreadsheet and Solver approach makes solving optimization problems a simple task and it is convenient for all users, regardless of their mathematical background. It is crucial to understand that changes may be made to the Solver parameters or to the performed method at any time. Depending on the results that the Solver tool gives us, we can reassess the problem and decide if we will need to execute a Solver process with constraints. Solver results are not just numbers, they are values with a specific meaning for the situation under study, so the data scientist or business analyst must critically evaluate these results and take further actions if the results are not meaningful or satisfactory. وزارة التعليم Ministry of Education 2024-1446 185

It is crucial to understand that changes may be made to the Solver parameters or to the performed method at any time.
Optimization
Dealing with Optimization Problems
What is Excel Solver?
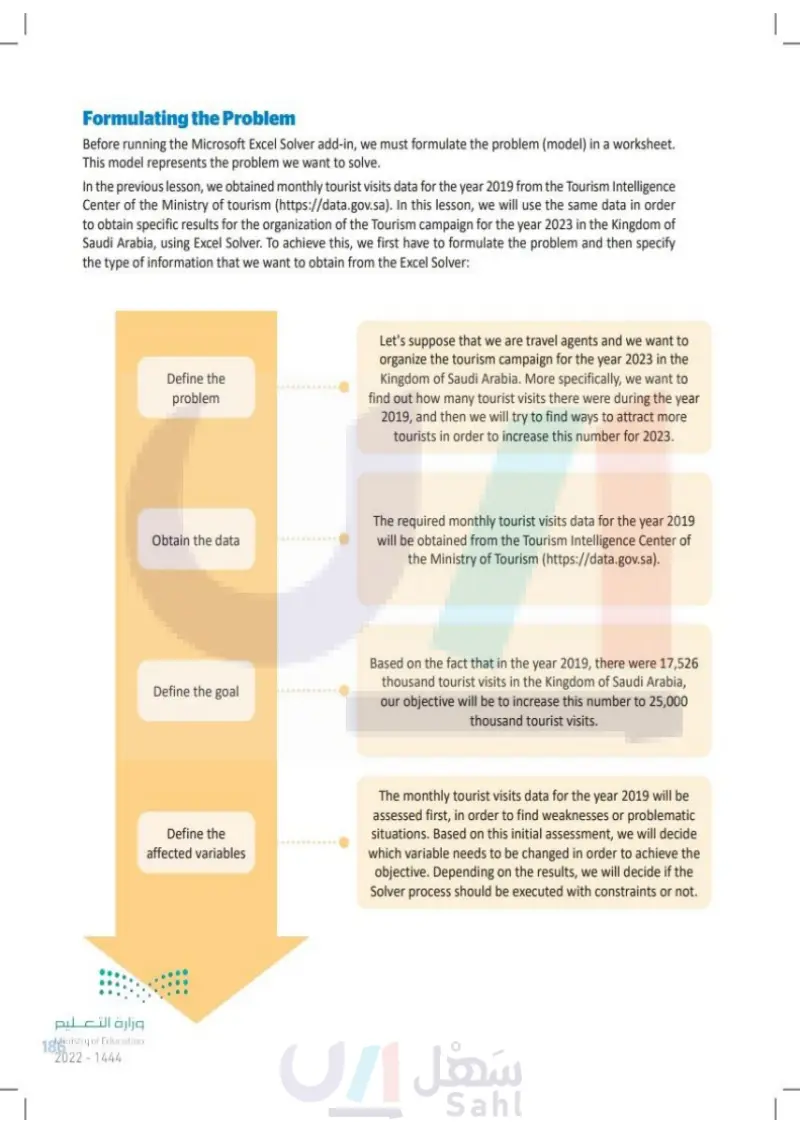
Formulating the Problem Before running the Microsoft Excel Solver add-in, we must formulate the problem (model) in a worksheet. This model represents the problem we want to solve. In the previous lesson, we obtained monthly tourist visits data for the year 2019 from the Tourism Intelligence Center of the Ministry of tourism (https://open.data.gov.sa). In this lesson, we will use the same data in order to obtain specific results for the organization of the Tourism campaign for the year 2023 in the Kingdom of Saudi Arabia, using Excel Solver. To achieve this, we first have to formulate the problem and then specify the type of information that we want to obtain from the Excel Solver: Define the problem Let's suppose that we are travel agents and we want to organize the tourism campaign for the year 2023 in the Kingdom of Saudi Arabia. More specifically, we want to find out how many tourist visits there were during the year 2019, and then we will try to find ways to attract more tourists in order to increase this number for 2023. Obtain the data The required monthly tourist visits data for the year 2019 will be obtained from the Tourism Intelligence Center of the Ministry of Tourism (https://open.data.gov.sa). Define the goal Based on the fact that in the year 2019 there were 17,526 thousands of tourist visits in the Kingdom of Saudi Arabia, our objective will be to increase this number to 25,000 thousands of tourist visits. Define the affected variables The monthly tourist visits data for the year 2019 will be assessed first, in order to find weaknesses or problematic situations. Based on this initial assessment, we will decide which variable needs to be changed in order to achieve the objective. Depending on the results, we will decide if the Solver process should be executed with constraints or not. وزارة التعليم Ministry of Education 186 2024-1446

Define the problem
Formulating the Problem
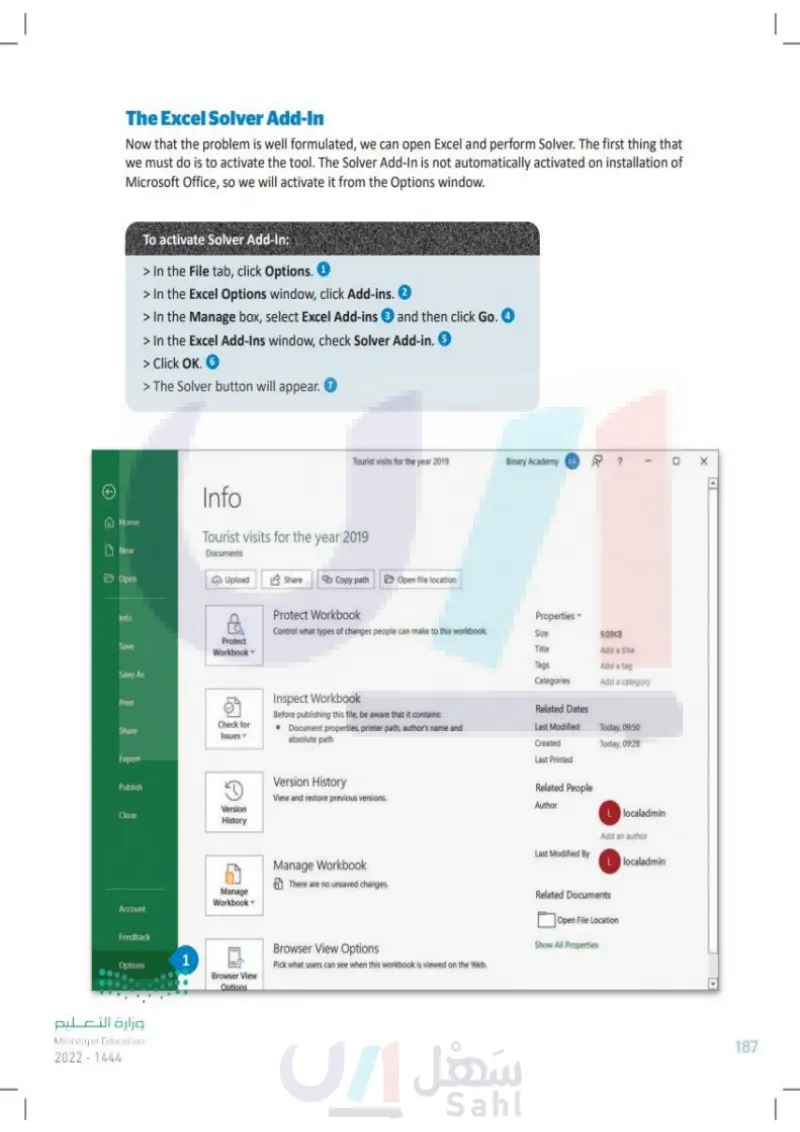
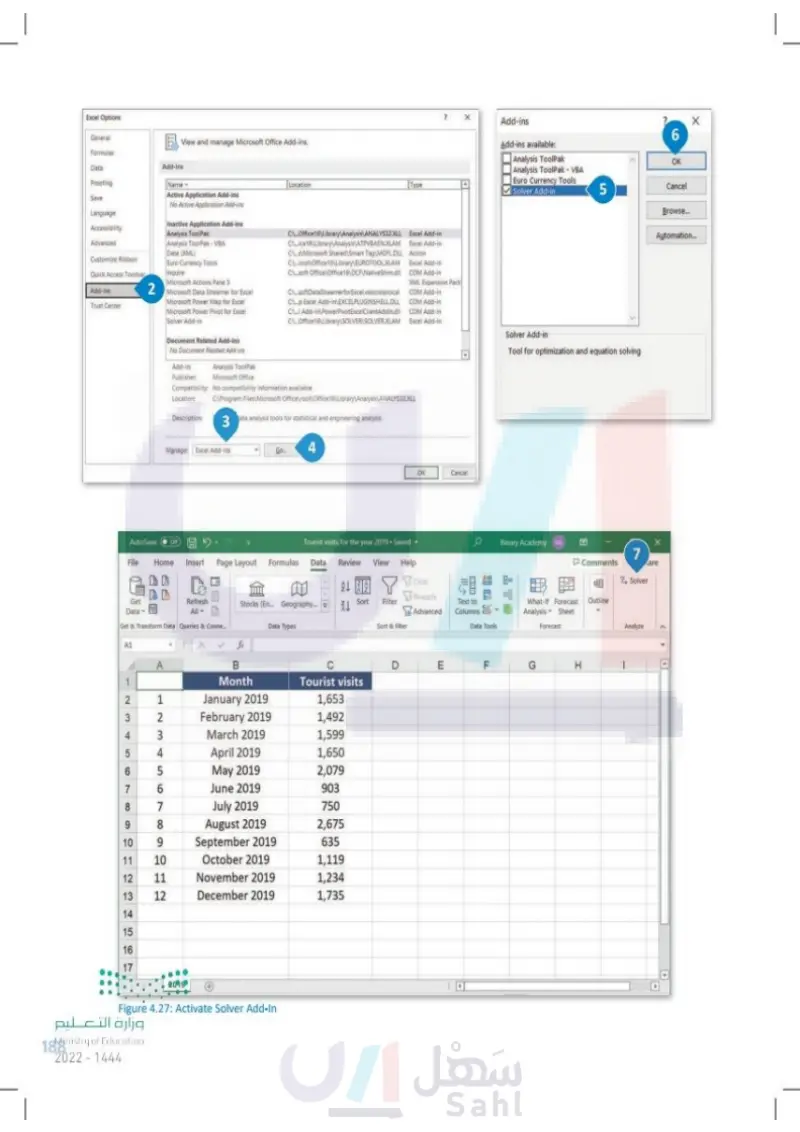
The Excel Solver Add-In Now that the problem is well formulated, we can open Excel and run Solver. The first thing that we must do is to activate the tool. The Solver Add-In is not automatically activated on installation of Microsoft Office, so we will activate it from the Options window. To activate Solver Add-In: > In the File tab, click Options. > In the Excel Options window, click Add-ins. 2 > In the Manage box, select Excel Add-ins 3 and then click Go. 4 > In the Excel Add-Ins window, check Solver Add-in. 5 > Click OK. 6 > The Solver button will appear. 7 Tourist visits for the year 2019 Binary Academy BA? Home New Open Info Tourist visits for the year 2019 Documents Upload Share Copy path Open file location 1 Info Protect Workbook Control what types of changes people can make to this workbook. Properties Size Save Protect Workbook Title 9.09KB Add a title Tags Add a tag Save As Categories Add a category Print Share Export Check for Issues Inspect Workbook Before publishing this file, be aware that it contains: ■ Document properties, printer path, author's name and absolute path Version History View and restore previous versions. Related Dates Last Modified Created Last Printed Related People Today, 09:50 Today, 09:28 Publish D Close Version History Account Manage Workbook There are no unsaved changes. Manage Workbook Author Last Modified By L localadmin Add an author Llocaladmin Related Documents Open File Location Feedback Browser View Options Show All Properties 1 Options Pick what users can see when this workbook is viewed on the Web. Browser View Options وزارة التعليم Ministry of Education 2024-1446 X 187

The Excel Solver Add-In
Excel Options General Formulas View and manage Microsoft Office Add-ins. ? Add-ins Add-ins available: 6 Analysis ToolPak OK Analysis ToolPak- VBA Euro Currency Tools Type Cancel Solver Add-in 5 Browse... Automation... Active Application Add-ins Data Proofing Add-ins Name Save Language Accessibility Advanced Customize Ribbon Quick Access Toolbar Add-ins Trust Center No Active Application Add-ins Inactive Application Add-ins Analysis ToolPak Analysis ToolPak-VBA Date (XML) Euro Currency Tools Inquire Microsoft Actions Pane 3 2 Microsoft Data Streamer for Excel Microsoft Power Map for Excel Microsoft Power Pivot for Excel Solver Add-in Document Related Add-ins No Document Related Add-ins Add-in Analysis ToolPak Location C:\Office16\Library\Analysis ANALYS32.XLL Excel Add-in Cice16\Library\Analysis ATPVBAEN.XLAM Excel Add-in CS\Microsoft Shared\Smart Tag\MOFLDLL Action Croot\Office16\Library\EUROTOOLXLAM Csoft Office\Office16\DCF NativeShim.dll Excel Add-in COM Add-in XML Expansion Pack COM Add-in COM Add-in CsoftDataStreamerfor Excelsstovstolocal Cp Excel Add-in EXCELPLUGINSHELL.DLL C. Add-in\PowerPivotExcelClientAddin.dil COM Add-in C_Office16\Library\SOLVER\SOLVERXLAM Excel Add-in Publisher Microsoft Office Compatibility: No compatibility information available CAProgram Files\Microsoft Office\root\Office16\Library\Analysis ANALYS32.XLL Location: Description: 3 ata analysis tools for statistical and engineering analysis Manage: Excel Add-ins 4 OK Cancel AutoSave Off File Tourist visits for the year 2019. Saved Home Insert Page Layout Formulas Data Review View Help Get Data Refresh All Get & Transform Data Queries & Conne... Solver Add-in Tool for optimization and equation solving Stocks (En... Geography... 21 32 ZJ Clear ↑ Sort Filter Reapply Advanced Text to Data Types Sort & Filter Columns Data Tools Binary Academy BA 7 Comments are ? Solver TO What-If Forecast Outline Analysis Sheet Forecast A1 A B D E F G H 1 Month Tourist visits 2 3 4 5 67 7 8 9 10 123456789 January 2019 1,653 February 2019 1,492 March 2019 1,599 April 2019 May 2019 June 2019 1,650 2,079 903 July 2019 750 August 2019 2,675 September 2019 635 11 10 October 2019 1,119 12 11 November 2019 1,234 13 12 December 2019 1,735 14 15 16 17 2019 وزارة التعليم Ministry of Education 188 2024-1446 Figure 4.27: Activate Solver Add-In Analyze 4V.

Activate Solver Add-In
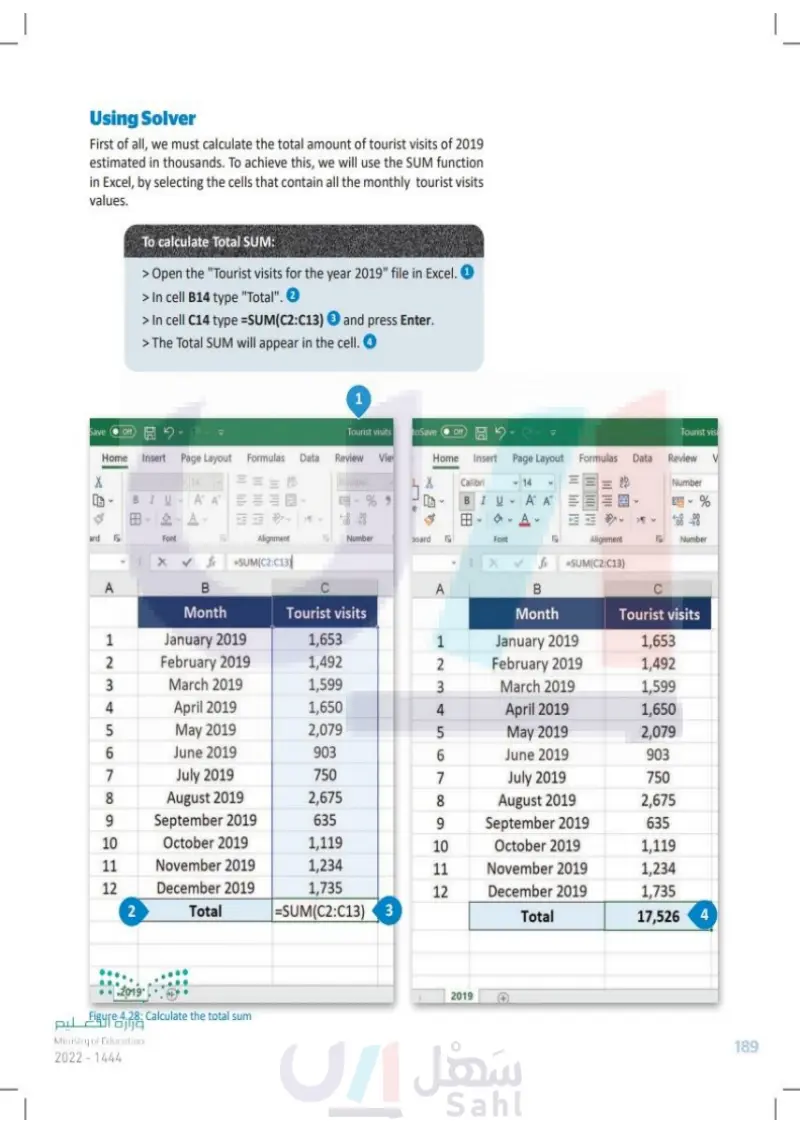
Using Solver First of all, we must calculate the total amount of tourist visits in 2019 estimated in thousands. To achieve this, we will use the SUM function in Excel, by selecting the cells that contain all the monthly tourist visits values. To calculate the SUM: > Open the "Tourist visits for the year 2019" file in Excel. 1 > In cell B14 type "Total". 2 > In cell C14 type =SUM(C2:C13) 3 and press Enter. > The total will appear in the cell. 4 1 Save Off Tourist visits toSave Off > Tourist vis Home Insert Page Layout Formulas Data Review Vie Home Insert Page Layout Formulas Data Review V X Number X Calibri <14 ab Number BIU AAE 0-% BIU 4 田& A 田 v 3 A A A V % ard 12 Font Alignment Number board E Font Alignment 四 Number fx =SUM(C2:C13) =SUM(C2:C13) A B A B C Month Tourist visits Month Tourist visits 123456789 January 2019 1,653 February 2019 1,492 March 2019 1,599 April 2019 1,650 May 2019 2,079 June 2019 903 July 2019 750 1234569 January 2019 1,653 February 2019 1,492 3 March 2019 1,599 4 April 2019 1,650 May 2019 2,079 June 2019 903 July 2019 750 August 2019 2,675 8 August 2019 2,675 September 2019 635 9 September 2019 635 10 October 2019 1,119 10 October 2019 1,119 11 November 2019 1,234 11 November 2019 1,234 12 December 2019 1,735 12 December 2019 1,735 2 Total =SUM(C2:C13) 3 Total 17,526 4 2019 وزارة التعليم Ministry of Education 2024-1446 2019 Figure 4.28: Calculate the total 189

Using Solver
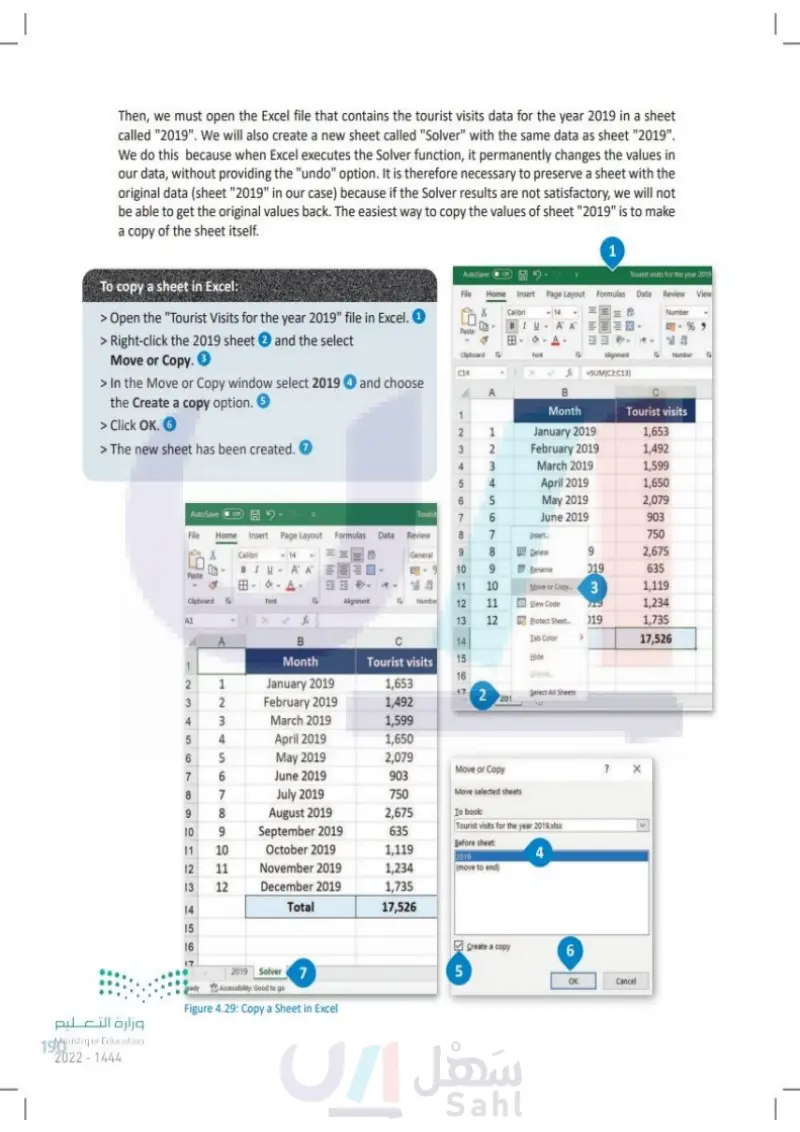
Next, we must open the Excel file that contains the tourist visits data for the year 2019 in a sheet called "2019". We will also create a new sheet called "Solver" with the same data as sheet "2019". We do this because when Excel executes the Solver function, it permanently changes the values in our data, without providing the "undo" option. It is therefore necessary to preserve a sheet with the original data (sheet "2019" in our case) because if the Solver results are not satisfactory, we will not be able to get the original values back. The easiest way to copy the values of sheet "2019" is to make a copy of the sheet itself. 1 Tourist visits for the year 2019 AutoSave Off To copy a sheet in Excel: > Open the "Tourist Visits for the year 2019" file in Excel. 1 > Right-click the 2019 sheet 2 and the select Move or Copy. 3 > In the Move or Copy window select 2019 4 and choose the Create a copy option. 5 > Click OK. 6 > The new sheet has been created. 7 File Home Insert Page Layout Formulas Data Review View X Calibri 14 Number BIU AA= % Paste 田。 95 Clipboard Font E Alignment Б Number 5 C14 $ =SUM(C2:C13) A B 1 Month Tourist visits 2 3 4 5 6 AutoSave Off Tourist 7 File Home Insert Page Layout Formulas Data Review 8 Calibri BIU 14 9 12345678 January 2019 1,653 February 2019 1,492 March 2019 1,599 April 2019 1,650 May 2019 2,079 June 2019 903 Insert... 750 General Delete 9 2,675 Y Paste A A A 10 11 11 9 Bename 019 635 10 Move or Copy.. 3 1,119 Clipboard Font Alignment Numbe 12 11 View Code 119 1,234 A1 13 12 Protect Sheet... 019 1,735 A B 14 Tab Color 17,526 Month 15 Hide 1 Tourist visits 16 Unhide 2 3 4 8 10 96 12345678 567 January 2019 1,653 17 2 Select All Sheets 201 February 2019 1,492 March 2019 1,599 April 2019 1,650 May 2019 2,079 Move or Copy June 2019 903 July 2019 750 Move selected sheets August 2019 2,675 To book 9 September 2019 635 Tourist visits for the year 2019.xlsx Before sheet: 12 13 123 10 October 2019 1,119 2019 4 11 November 2019 1,234 (move to end) 12 December 2019 1,735 14 Total 17,526 15 وزارة التعليم Ministry of Education 190 2024-1446 567 16 2019 Solver 7 teady Accessibility: Good to go Create a copy 6 5 Figure 4.29: Copy a Sheet in Excel OK Cancel

To copy a sheet in Excel
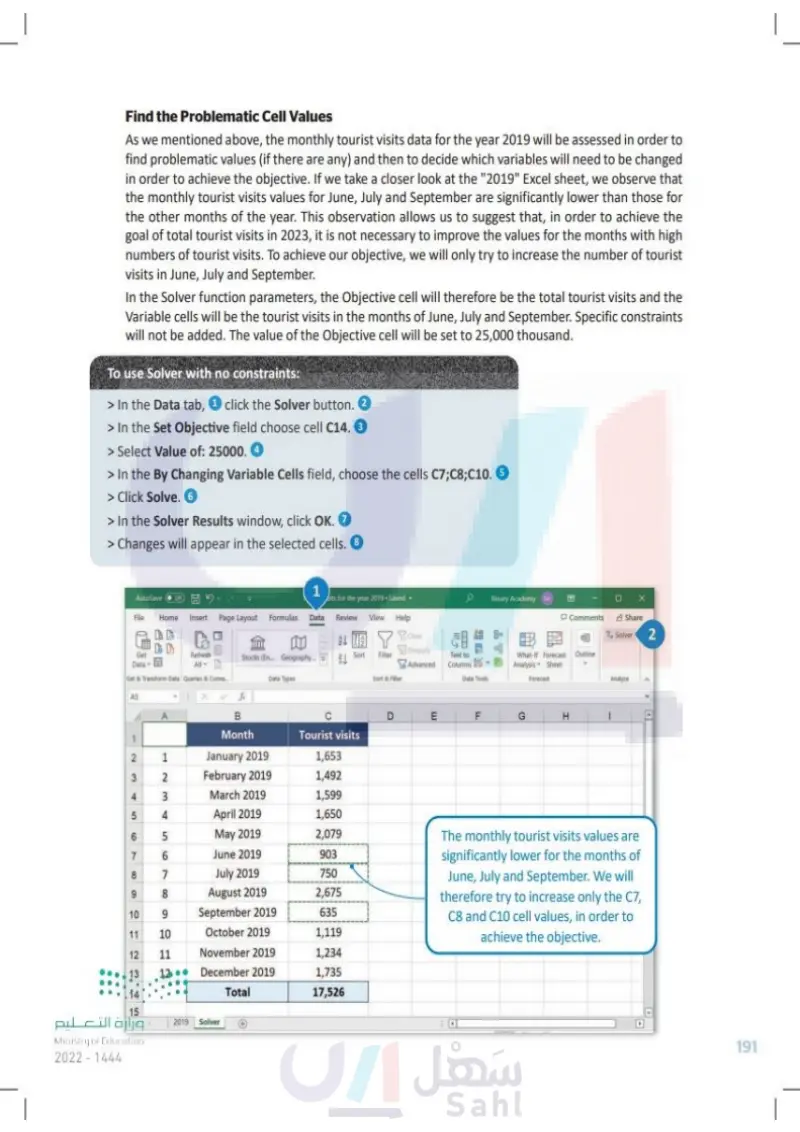
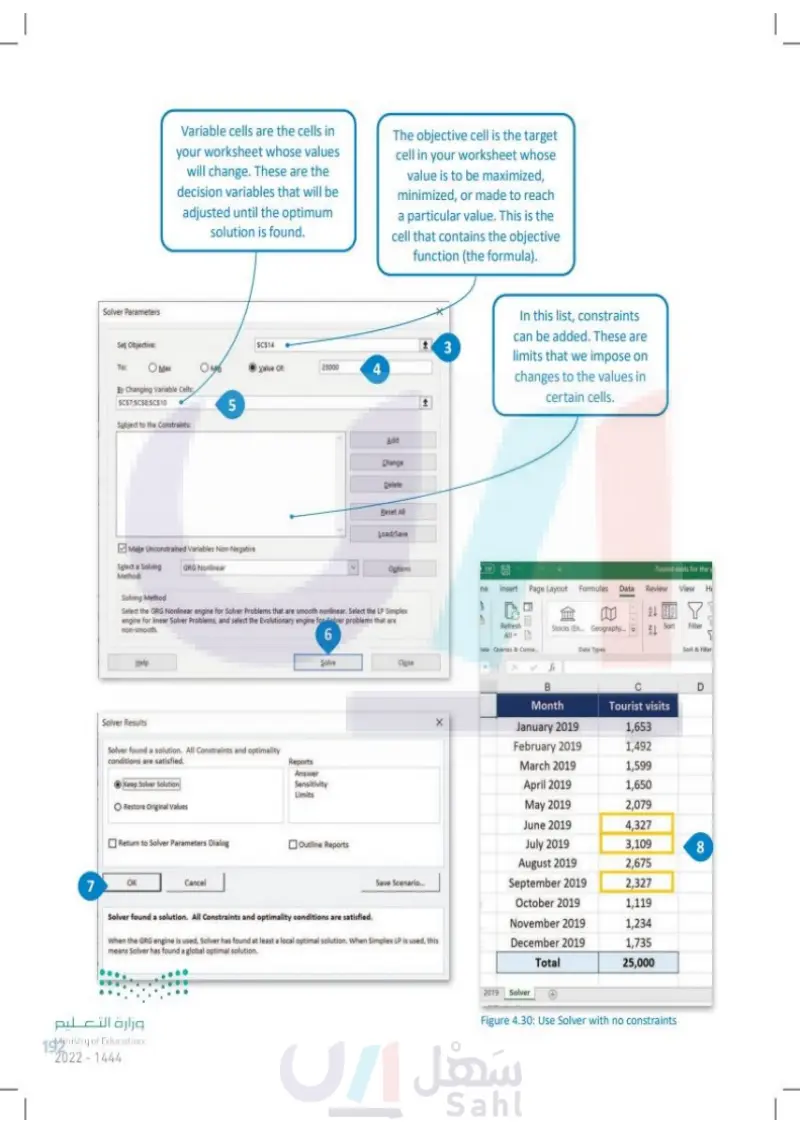
Find the Problematic Cell Values As we mentioned above, the monthly tourist visits data for the year 2019 will be assessed in order to find problematic values (if there are any) and then to decide which variables will need to be changed in order to achieve the objective. If we take a closer look at the "2019" Excel spreadsheet, we observe that the monthly tourist visits values for June, July and September are significantly lower than those for the other months of the year. This observation allows us to suggest that, in order to achieve the goal of total tourist visits in 2023, it is not necessary to improve the values for the months with high numbers of tourist visits. To achieve our objective, we will only try to increase the number of tourist visits in June, July and September. In the Solver function parameters, the Objective cell will therefore be the total tourist visits and the Variable cells will be the tourist visits in the months of June, July and September. Specific constraints will not be added. The value of the Objective cell will be set to 25,000. To use Solver with no constraints: > In the Data tab, 1 click the Solver button. 2 > In the Set Objective field choose cell C14. > Select Value Of: and type 25000. 4 > In the By Changing Variable Cells field, choose the cells C7;C8;C10. 5 > Click Solve. 6 > In the Solver Results window, click OK. 7 > Changes will appear in the selected cells. 8 AutoSave Off File 1 its for the year 2019. Saved Home Insert Page Layout Formulas Data Review View Help Get Data Refresh All Get & Transform Data Queries & Conne... 21 22 Stocks (En... Geography... Sort Filter Clear Reapply Advanced Text to Columns Data Types Sort & Filter Data Tools A1 A B Month Tourist visits 2 1 January 2019 1,653 3 4 5 234 February 2019 1,492 March 2019 1,599 4 April 2019 1,650 9 7 56 May 2019 2,079 6 June 2019 903 8 7 July 2019 750 6 8 August 2019 2,675 10 11 12 13 92 September 2019 635 10 October 2019 1,119 11 November 2019 1,234 12 December 2019 1,735 14 Total 17,526 2019 Solver وزارة التعليم Ministry of Education 2024-1446 Binary Academy BA Comments Share 品管圈 2. Solver 2 Analysis Forecast What-if Forecast Outline Sheet Analyze E F G H The monthly tourist visits values are significantly lower for the months of June, July and September. We will therefore try to increase only the C7, C8 and C10 cell values, in order to achieve the objective. 191

Find the Problematic Cell Values
To use Solver with no constraints
Solver Parameters Set Objective: To: O Max Variable cells are the cells in your worksheet whose values will change. These are the decision variables that will be adjusted until the optimum solution is found. The objective cell is the target cell in your worksheet whose value is to be maximized, minimized, or made to reach a particular value. This is the cell that contains the objective function (the formula). By Changing Variable Cells: $C$7:5C58;$C$10 Subject to the Constraints: SC$14 13 OM Value Of: 25000 4 5 Make Unconstrained Variables Non-Negative Add Change Delete Reset All Load/Save Select a Solving GRG Nonlinear Options Method: Solving Method Select the GRG Nonlinear engine for Solver Problems that are smooth nonlinear. Select the LP Simplex engine for linear Solver Problems, and select the Evolutionary engine for Solver problems that are non-smooth. 6 Help Solve Solver Results Solver found a solution. All Constraints and optimality conditions are satisfied. Keep Solver Solution Restore Original Values Reports Answer Sensitivity Limits Return to Solver Parameters Dialog Outline Reports 7 OK Cancel In this list, constraints can be added. These are limits that we impose on changes to the values in certain cells. Off Tourist visits for the g ne Insert Page Layout Formulas Data Review View 21 P Stocks (En... Geography...Sort Filter Refresh All lata Queries & Conne.... Close Data Types: Sort & Filter B D Month Tourist visits January 2019 1,653 February 2019 1,492 March 2019 1,599 April 2019 1,650 May 2019 2,079 June 2019 4,327 July 2019 3,109 8 August 2019 2,675 Save Scenario... September 2019 2,327 October 2019 1,119 November 2019 1,234 December 2019 1,735 Total 25,000 Solver found a solution. All Constraints and optimality conditions are satisfied. When the GRG engine is used, Solver has found at least a local optimal solution. When Simplex LP is used, this means Solver has found a global optimal solution. وزارة التعليم Ministry of Education 192 2024-1446 2019 Solver Figure 4.30: Use Solver with no constraints

Use Solver with no constraints
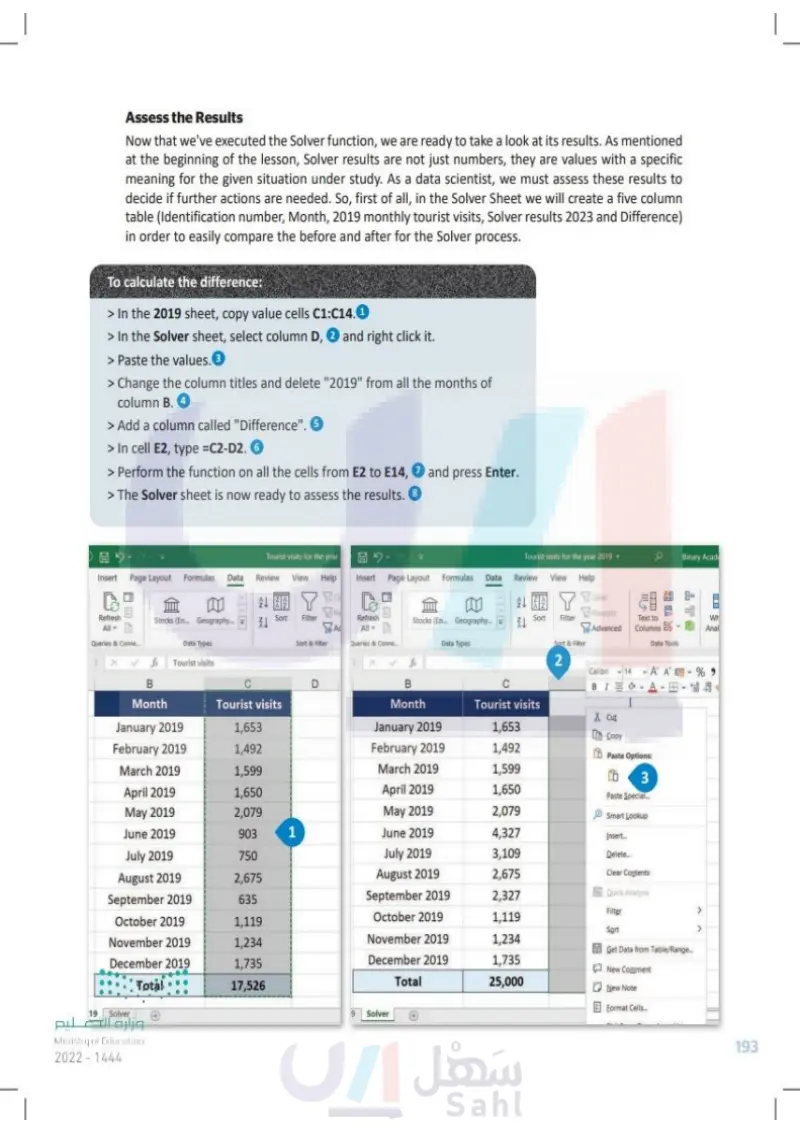
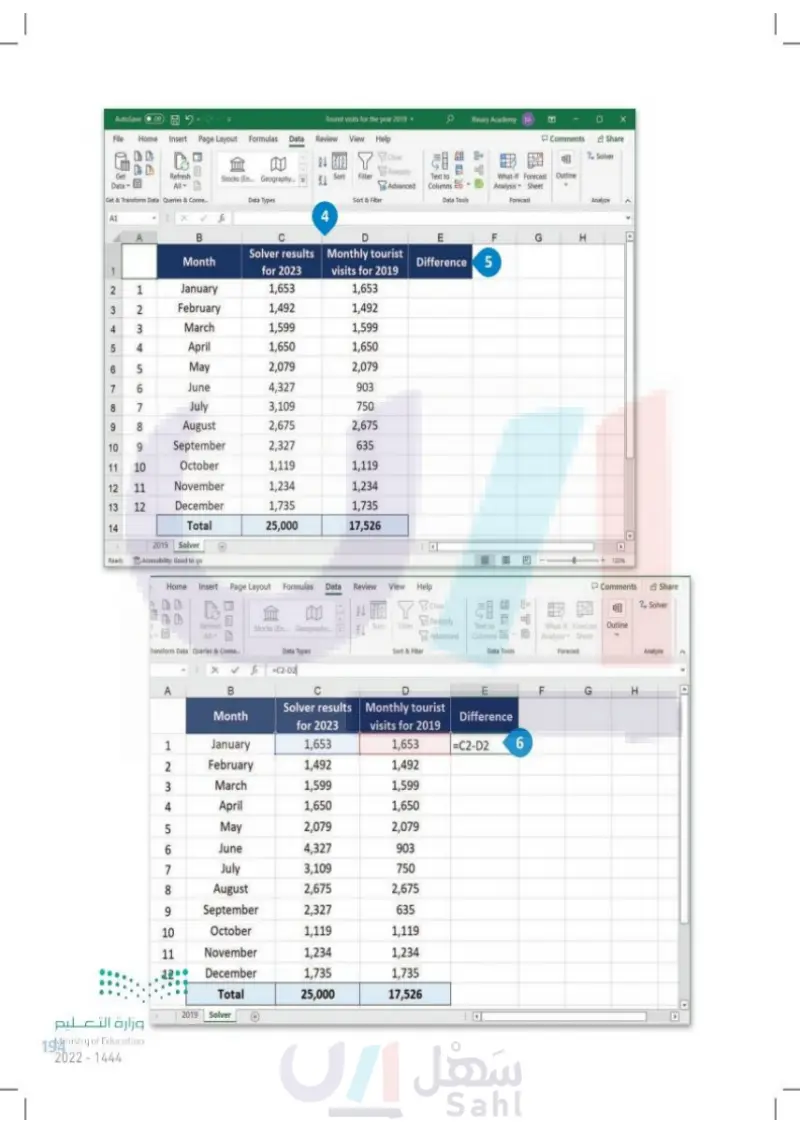
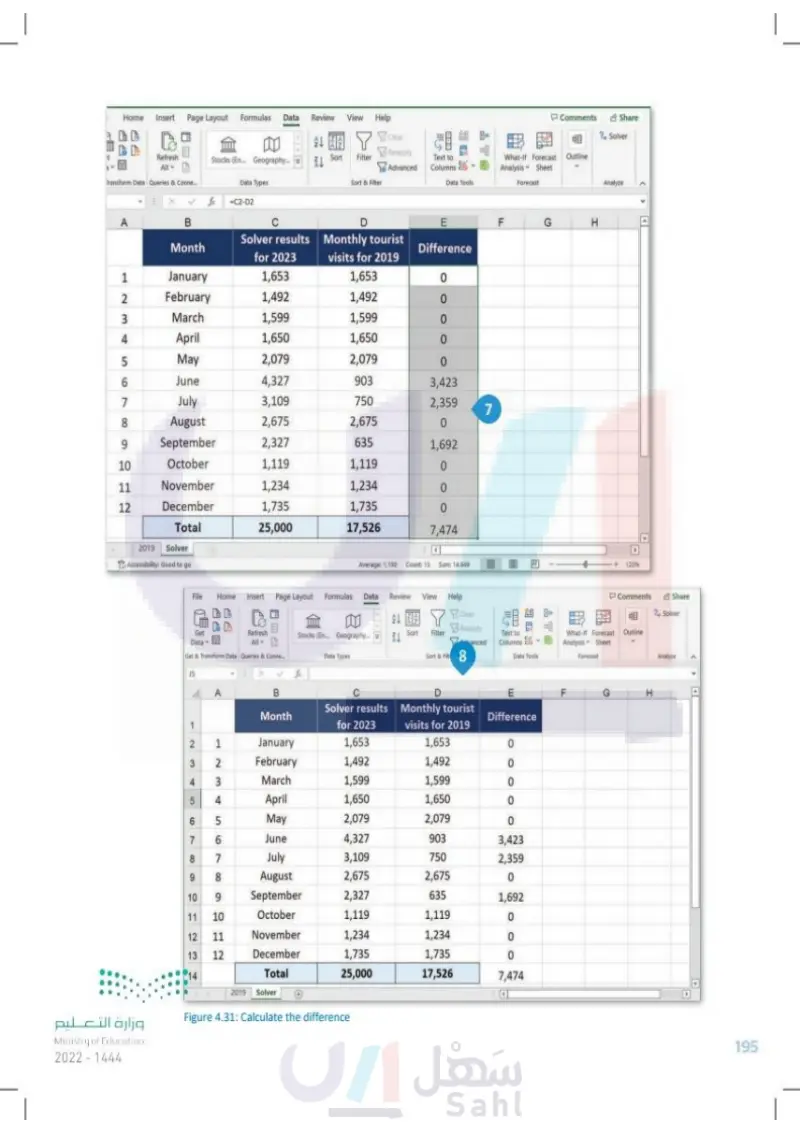
Assess the Results Now that we've executed the Solver function, we are ready to take a look at its results. As mentioned at the beginning of the lesson, Solver results are not just numbers, they are values with a specific meaning for the given situation under study. As a data scientist, we must assess these results to decide if further actions are needed. So, first of all, in the Solver Sheet we will create a five column table (Identification number, Month, 2019 monthly tourist visits, Solver results 2023 and Difference) in order to easily compare the before and after for the Solver process. To calculate the difference: > In the 2019 sheet, copy value cells C1:C14.1 > In the Solver sheet, select column D, 2 and right click it. > Paste the values. 3 > Change the column titles and delete "2019" from all the months of column B. 4 > Add a column called "Difference". 5 > In cell E2, type =C2-D2. > Perform the function on all the cells from E2 to E14, 7 and press Enter. > The Solver sheet is now ready to assess the results. 8 Insert Page Layout Formulas Data Tourist visits for the year Review View Help 2 Insert Page Layout Formulas Tourist visits for the year 2019 Data Review View Help Binary Acade 22Y Clear Re ↑ Refresh All Stocks (En... Geography... Sort Filter Ac Queries & Conne... Data Types Sort & Filter Refresh All Queries & Conne... Stocks (En... Geography... Sort Filter ➤N Reapply Advanced Text to Wh Columns E Anal Data Types Sort & Filter Data Tools X Tourist visits 2 B Month C D B C Calibri 14 AA-% 3 BIA 808 Tourist visits Month Tourist visits X Cut January 2019 1,653 January 2019 1,653 February 2019 1,492 February 2019 1,492 Copy Paste Options: March 2019 1,599 March 2019 1,599 3 April 2019 1,650 April 2019 1,650 Paste Special... May 2019 2,079 May 2019 2,079 Smart Lookup June 2019 903 1 June 2019 4,327 Insert... July 2019 750 July 2019 3,109 Delete... August 2019 2,675 August 2019 2,675 Clear Contents September 2019 635 September 2019 2,327 Quick Analysis Filter October 2019 1,119 October 2019 1,119 Sort > November 2019 1,234 November 2019 1,234 Get Data from Table/Range... December 2019 2019 1,735 December 2019 1,735 Total 17,526 Total 25,000 19 Ministry of Education 2024-1446 هزاره النوم ليم New Comment New Note Format Cells... 9 Solver 193

To calculate the difference
Assess the Results
AutoSave Off File Home Insert Page Layout Formulas Data Tourist visits for the year 2019 Binary Academy EA Review View Help 212 Clear ↑ 目 Comments Share 2, Solver Get Datav目 Refresh All-> Stocks (En... Geography... Sort Filter Get & Transform Data Queries & Conne... Data Types Sort & Filter Reapply Advanced Text to Columns Data Tools What-if Forecast Outline Analysis Sheet Forecast Analyze fx 4 A B D ய E EL F G H Solver results Month 1 for 2023 Monthly tourist visits for 2019 Difference 5 2 1 January 1,653 1,653 3 2 February 1,492 1,492 4 3 March 1,599 1,599 5 4 April 1,650 1,650 99 6 7 8 567 May 2,079 2,079 6 June 4,327 903 July 3,109 750 6 8 August 2,675 2,675 10 9 September 2,327 635 12 11 10 October 1,119 1,119 12 11 November 1,234 1,234 13 12 December 1,735 1,735 14 Total 25,000 17,526 2019 Solver Ready Accessibility: Good to go Home Insert Page Layout Formulas Data Review View Help 120% Comments Share ?, Solver Analyze Refresh All Stocks (En Geography... 529 Transform Data Queries & Conne... Data Types Clear Sort Filter Reapply Advanced Sort & Filter 品管 Text to Columns Data Tools What-If Forecast Outline Analysis Sheet Forecast fx-C2-02 A B C D E LL F G H Month Solver results for 2023 Monthly tourist visits for 2019 Difference 1234 1 January 1,653 1,653 |=C2-D2 6 2 February 1,492 1,492 March 1,599 1,599 4 April 1,650 1,650 5 May 2,079 2,079 6 June 4,327 903 7 July 3,109 750 80 August 2,675 2,675 9 September 2,327 635 10 October 1,119 1,119 11 November 1,234 1,234 12 December 1,735 1,735 Total 25,000 17,526 2019 Solver وزارة التعليم Ministry of Education 194 2024-1446 4

To calculate the difference: Month
4 Stocks (En... Geography... Data Types Home Insert Page Layout Formulas Data Review View Help B 21 2 Clear Reapply Refresh All- NA Sort Filter Advanced Text to Columns Transform Data Queries & Conne... Sort & Filter Data Tools Comments Share ?, Solver What-If Forecast Outline Analysis Sheet Forecast Analyze fx =C2-D2 A B C D E F G H Solver results Monthly tourist Month Difference for 2023 visits for 2019 1 January 1,653 1,653 0 234 2 February 1,492 1,492 0 March 1,599 1,599 0 April 1,650 1,650 0 5 May 2,079 2,079 0 9 June 4,327 903 3,423 7 July 3,109 750 2,359 7 8 August 2,675 2,675 0 9 September 2,327 635 1,692 10 October 1,119 1,119 0 11 November 1,234 1,234 0 12 December 1,735 1,735 0 Total 25,000 17,526 7,474 2019 Solver Accessibility: Good to go وزارة التعليم Ministry of Education 2024-1446 File Get Data Average: 1,150 Count: 13 Sum: 14,949 Home Insert Page Layout Formulas Data Review View Help Refresh All Get & Transform Data Queries & Conne Stocks (En... Geography... 21 2 ZJ Clear Reapply Sort Filter vanced Data Types Sort & Fi8 Text to E Columns Data Tools 品質 15 X B C E Month 1 Solver results for 2023 Monthly tourist visits for 2019 Difference 2 1 January 1,653 1,653 0 3 4 23 2 February 1,492 1,492 0 March 1,599 1,599 0 5 4 April 1,650 1,650 0 6 5 May 2,079 2,079 0 7 9 June 4,327 903 3,423 8 7 July 3,109 750 2,359 6 8 August 2,675 2,675 0 10 9 September 2,327 635 1,692 11 10 October 1,119 1,119 0 12 11 November 1,234 1,234 0 13 12 December 1,735 1,735 0 14 Total 25,000 17,526 7,474 2019 Solver Figure 4.31: Calculate the difference 120% Comments Share ? Solver What-If Forecast Outline Sheet Analysis Forecast ןד F G H Analyze 195

Calculate the difference
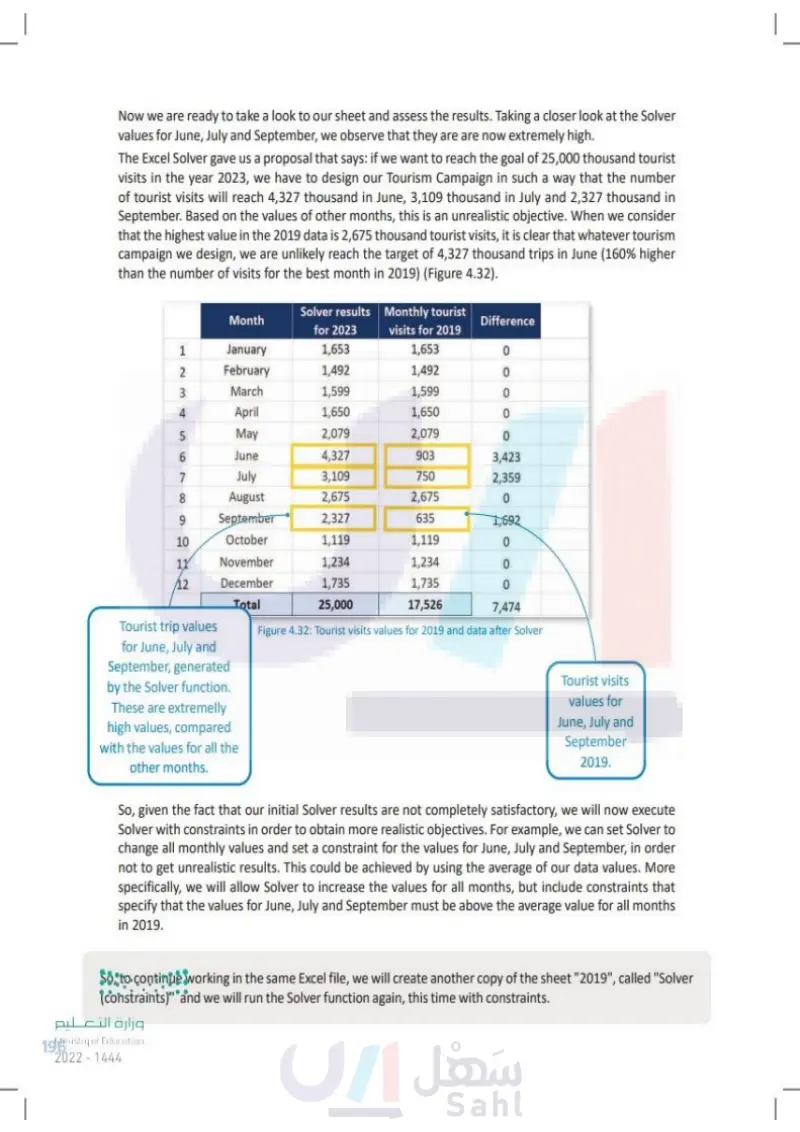
Now we are ready to take a look at our sheet and assess the results. Taking a closer look at the Solver values for June, July and September, we observe that they are are now extremely high. The Excel Solver gave us a proposal that says: if we want to reach the goal of 25,000 thousand tourist visits in the year 2023, we have to design our Tourism Campaign in such a way that the number of tourist visits will reach 4,327 thousands of visits in June, 3,109 in July and 2,327 in September. Based on the values of other months, this is an unrealistic objective. When we consider that the highest value in the 2019 data is 2,675 thousands of tourist visits, it is clear that whatever tourism campaign we design, we are unlikely reach the target of 4,327 thousands of visits in June (160% higher than the number of visits for the best month in 2019) (Figure 4.32). Month Solver results for 2023 Monthly tourist visits for 2019 Difference 12 1 January 1,653 1,653 0 2 February 1,492 1,492 0 345 March 1,599 1,599 0 April 1,650 1,650 0 May 2,079 2,079 0 9 June 4,327 903 3,423 7 July 3,109 750 2,359 8 August 2,675 2,675 0 9 September 2,327 635 1,692 10 October 1,119 1,119 0 12 November 1,234 1,234 0 12 December 1,735 1,735 0 Total 25,000 17,526 7,474 Tourist trip values for June, July and September, generated by the Solver function. These are extremelly high values, compared with the values for all the other months. Figure 4.32: Tourist visits values for 2019 and data after Solver Tourist visits values for June, July and September 2019. So, given the fact that our initial Solver results are not completely satisfactory, we will now execute Solver with constraints in order to obtain more realistic objectives. For example, we can set Solver to change all monthly values and set a constraint for the values for June, July and September, in order not to get unrealistic results. This could be achieved by using the average of our data values. More specifically, we will allow Solver to increase the values for all months, but include constraints that specify that the values for June, July and September must be above the average value for all months in 2019. So, to continue working in the same Excel file, we will create another copy of the sheet "2019", called "Solver (constraints)" and we will run the Solver function again, this time with constraints. وزارة التعليم Ministry of Education 196 2024-1446

Now we are ready to take a look to our sheet and assess the results. Taking a closer look at the Solver values for June, July and September, we observe that they are are now extremely high.
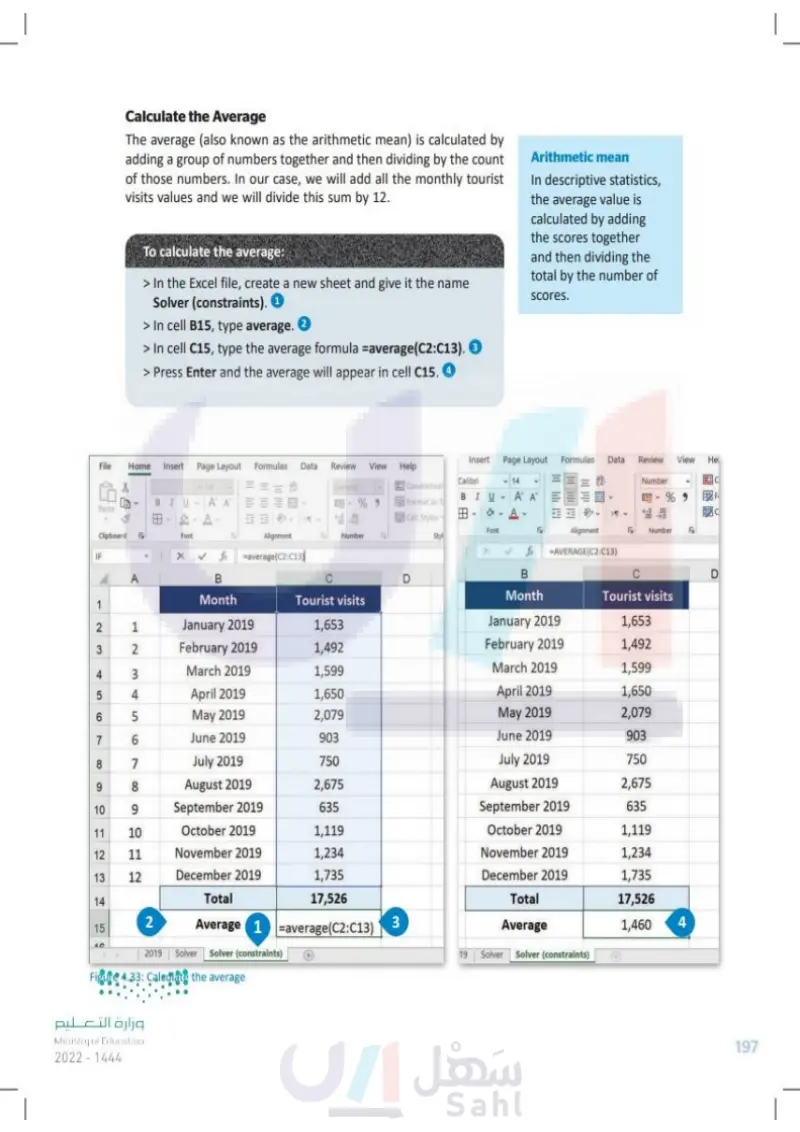
Calculate the Average The average (also known as the arithmetic mean) is calculated by adding a group of numbers together and then dividing by the count of those numbers. In our case, we will add all the monthly tourist visits values and we will divide this sum by 12. To calculate the average: > In the Excel file, create a new sheet and give it the name Solver (constraints). 1 > In cell B15, type average. ② > In cell C15, type the average formula =average(C2:C13). ③ > Press Enter and the average will appear in cell C15. 4 Arithmetic mean In descriptive statistics, the average value is calculated by adding the scores together and then dividing the total by the number of scores. File Home Insert 14 三三三卷 BIU 4 AAE Paste 田 A Clipboard IF Font Page Layout Formulas Data Review View Help General Conditional Calibri BIU Format as T Cell Styles 田 Alignment Number Styl Insert Page Layout Formulas Data Review View He -14 4 A A A Number % F Font B X A B fx average(C2:C13) Alignment =AVERAGE(C2:C13) Number B D C Month 1 Tourist visits Month Tourist visits 2 1 January 2019 1,653 January 2019 1,653 3 2 February 2019 1,492 February 2019 1,492 34 45 March 2019 1,599 March 2019 1,599 April 2019 1,650 April 2019 1,650 6 5 May 2019 2,079 May 2019 2,079 7 6 June 2019 903 June 2019 903 8 7 July 2019 750 July 2019 750 9 8 August 2019 2,675 August 2019 2,675 10 9 September 2019 635 September 2019 635 11 10 October 2019 1,119 October 2019 1,119 12 11 November 2019 1,234 November 2019 1,234 13 12 December 2019 1,735 December 2019 1,735 14 Total 17,526 Total 17,526 2 15 Average 1 average (C2:C13) 3 Average 1,460 4 16 2019 Solver Solver (constraints) 19 Solver Solver (constraints) Figure 4.33: Calculate the average وزارة التعليم Ministry of Education 2024-1446 197

Calculate the average
To calculate the average
Calculate the Average
Arithmetic mean
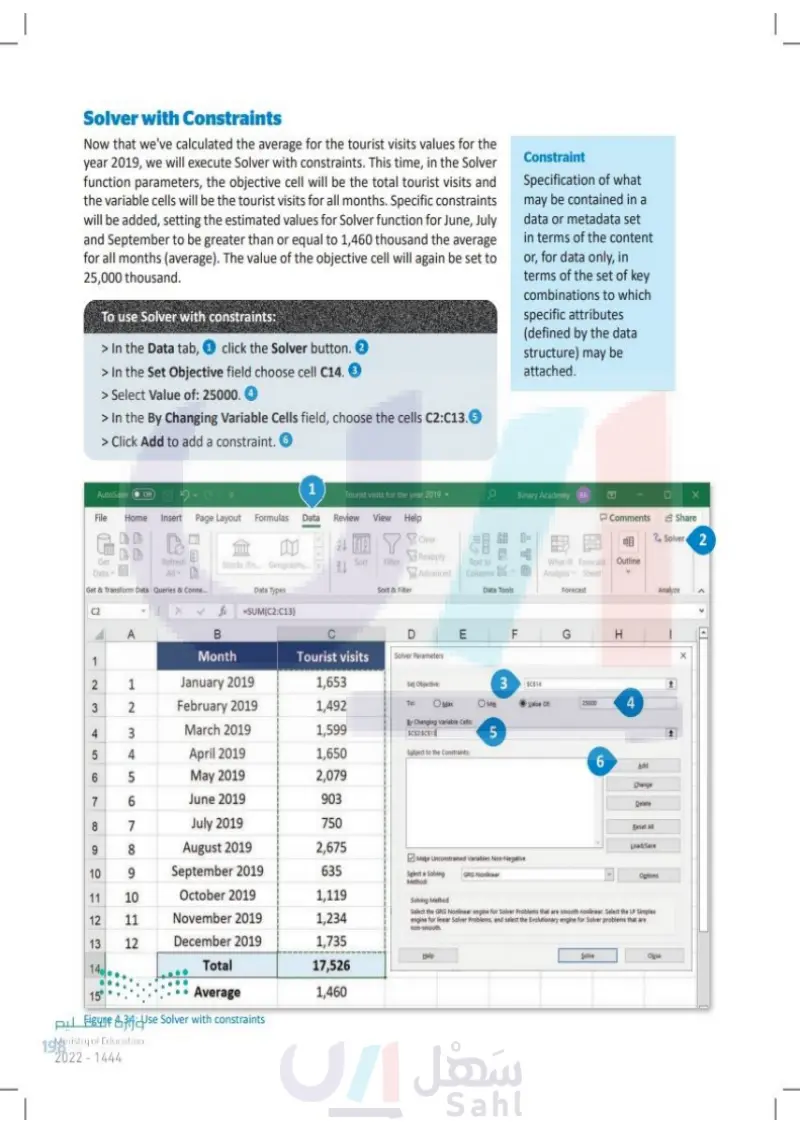
Solver with Constraints Now that we've calculated the average for the tourist visits values for the year 2019, we will execute Solver with constraints. This time, in the Solver function parameters, the objective cell will be the total tourist visits and the variable cells will be the tourist visits for all months. Specific constraints will be added, setting the estimated values for the Solver function for June, July and September to be greater than or equal to 1,460 the average for all months (average). The value of the objective cell will again be set to 25,000. To use Solver with constraints: > In the Data tab, 1 click the Solver button. 2 > In the Set Objective field choose cell C14. 3 > Select Value Of: and type 25000. 4 > In the By Changing Variable Cells field, choose the cells C2:C13.5 > Click Add to add a constraint. ⑥ Constraint Specification of what may be contained in a data or metadata set in terms of the content or, for data only, in terms of the set of key combinations to which specific attributes (defined by the data structure) may be attached. 1 AutoSave Off = Tourist visits for the year 2019 Binary Academy BA File Home Insert Page Layout Formulas Data Review View Help Comments Share Clear ? Solver 2 Get Data Refresh All-> Get & Transform Data Queries & Conne... Stocks (En... Geography... N< Z↓ Sort Filter Reapply Advanced Text to Columns What-if Forecast Outline Analysis Sheet Sort & Filter Data Tools Forecast Analyze 4 Data Types C2 A =SUM(C2:C13) B C D E F G H Month Tourist visits Solver Parameters 1 4 5 22 23 34 1 January 2019 1,653 Set Objective: 3 SCS14 February 2019 March 2019 1,492 To: O Max O Min Value Of 25000 4 1,599 By Changing Variable Cells: SCS2-SCS13 5 4 April 2019 1,650 Subject to the Constraints: 9 6 5 May 2019 2,079 7 8 67 June 2019 903 6 Add Change Delete 7 July 2019 750 Beset All 9 10 8 6 August 2019 September 2019 2,675 Load/Save Make Unconstrained Variables Non-Negative 635 Select a Solving GRG Nonlinear Options Method 11 10 October 2019 1,119 Solving Method 12 11 November 2019 1,234 Select the GRG Nonlinear engine for Solver Problems that are smooth nonlinear. Select the LP Simplex engine for linear Solver Problems, and select the Evolutionary engine for Solver problems that are non-smooth. 13 12 December 2019 1,735 Help Solve Close 14 Total 17,526 15 Average 1,460 وزارة التعليم Figure 4.34: Use Solver with constraints Ministry of Education 198 2024-1446

Use Solver with constraints
To use Solver with constraints
Solver with Constraints
Constraint
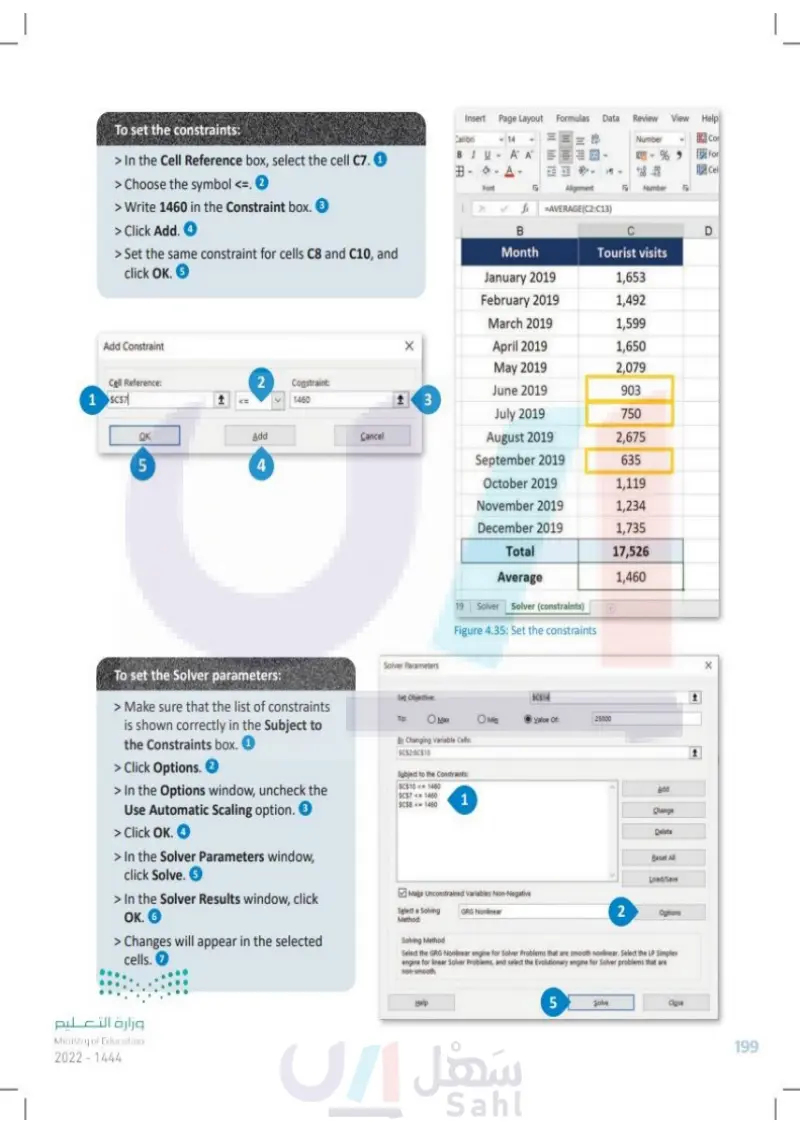
Insert Page Layout Formulas Data Review View Help To set the constraints: > In the Cell Reference box, select the cell C7. 1 > Choose the symbol <=. 2 > Write 1460 in the Constraint box. 3 > Click Add. 4 > Set the same constraint for cells C8 and C10, and click OK. 5 Calibri 14 BI S AA E 3 A 田 Font Number Cor %9 For Cell fx Alignment =AVERAGE(C2:C13) Number Add Constraint Cell Reference: 2 1 SCS7 1 Constraint: 1460 OK Add 5 4 Cancel B D Month Tourist visits January 2019 1,653 February 2019 1,492 March 2019 1,599 X April 2019 1,650 May 2019 2,079 June 2019 903 3 July 2019 750 August 2019 2,675 September 2019 635 October 2019 1,119 November 2019 1,234 December 2019 1,735 Total 17,526 1,460 Average 19 Solver Solver (constraints) Figure 4.35: Set the constraints To set the Solver parameters: > Make sure that the list of constraints is shown correctly in the Subject to the Constraints box. 1 > Click Options. 2 > In the Options window, uncheck the Use Automatic Scaling option. ③ > Click OK. 4 > In the Solver Parameters window, click Solve. 5 > In the Solver Results window, click OK. 6 > Changes will appear in the selected cells. 7 Solver Parameters Set Objective: To: O Max By Changing Variable Cells: SCS2:SC$13 Subject to the Constraints: SC$10 <= 1460 $C$7<= 1460 SCS8<=1460 1 1 SCS14 Min Value Of: 25000 Make Unconstrained Variables Non-Negative GRG Nonlinear Select a Solving Method: Solving Method Add Change Delete Beset All Load/Save 2 Options Select the GRG Nonlinear engine for Solver Problems that are smooth nonlinear. Select the LP Simplex engine for linear Solver Problems, and select the Evolutionary engine for Solver problems that are non-smooth. 1 وزارة التعليم Ministry of Education 2024-1446 Help 5 Solve Close 199

To set the Solver parameters
To set the constraints
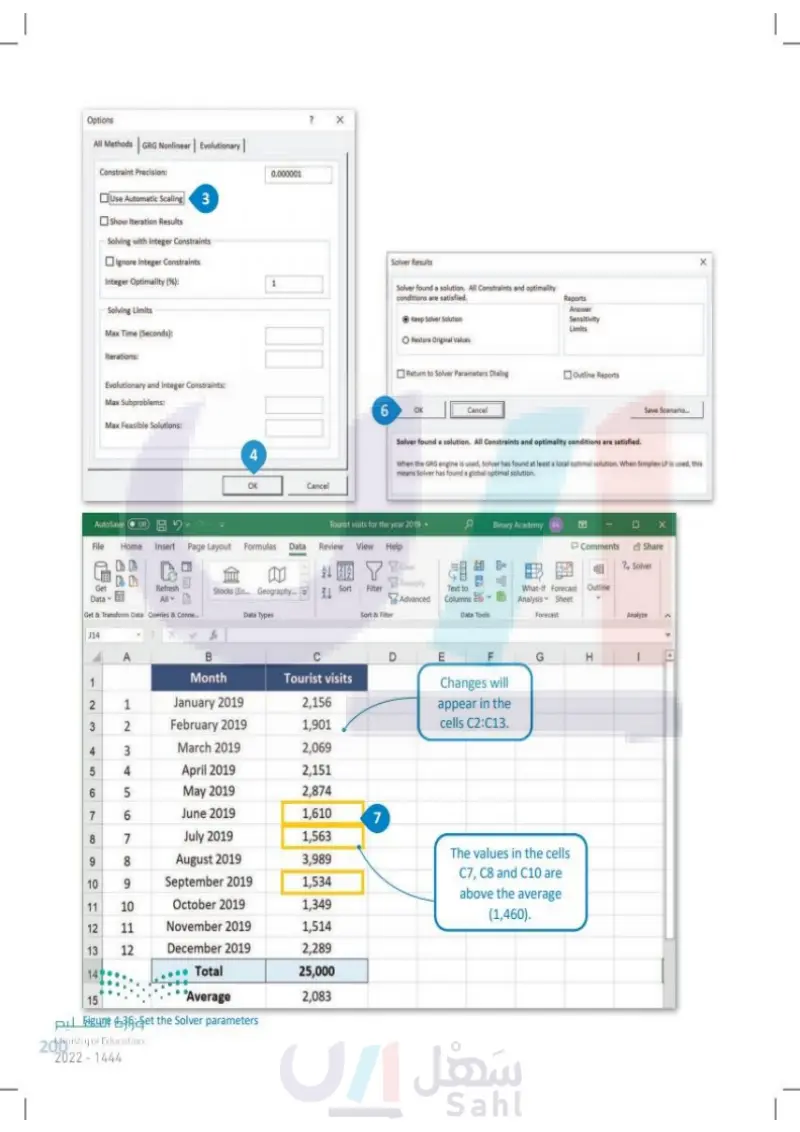
Options All Methods GRG Nonlinear | Evolutionary Constraint Precision: 0.000001 Use Automatic Scaling 3 Show Iteration Results Solving with Integer Constraints Ignore Integer Constraints Integer Optimality (%); Solving Limits Max Time (Seconds): Iterations: Evolutionary and Integer Constraints: Max Subproblems: Max Feasible Solutions: AutoSave Off 4 OK Cancel Solver Results Solver found a solution. All Constraints and optimality conditions are satisfied. Keep Solver Solution Restore Original Values Reports Answer Sensitivity Limits Return to Solver Parameters Dialog Outline Reports 6 OK Cancel Save Scenario... X Solver found a solution. All Constraints and optimality conditions are satisfied. When the GRG engine is used, Solver has found at least a local optimal solution. When Simplex LP is used, this means Solver has found a global optimal solution. Tourist visits for the year 2019 Binary Academy BA Comments Share 明 ?, Solver File Home Insert Page Layout Formulas Data Review View Help Get Data Refresh All Get & Transform Data Queries & Conne... Stocks (En... Geography... Data Types NA Clear Sort Filter Reapply Advanced Text to Columns Sort & Filter Data Tools What-If Forecast Outline Analysis Sheet Forecast J14 A B D E F G H Month 1 Tourist visits 2 3 72 1 January 2019 2,156 2 February 2019 1,901 Changes will appear in the cells C2:C13. 4 5 34 3 March 2019 2,069 4 April 2019 2,151 6 5 May 2019 2,874 7 6 June 2019 1,610 7 8 7 July 2019 1,563 6 10 8 6 August 2019 The values in the cells 3,989 September 2019 1,534 11 10 October 2019 1,349 C7, C8 and C10 are above the average (1,460). 12 11 November 2019 1,514 13 12 December 2019 2,289 14 Total 25,000 15 2,083 وزارة التعليم Average Figure 4.36: Set the Solver parameters Ministry of Education 200 2024-1446 Analyze >> D

Set the Solver parameters
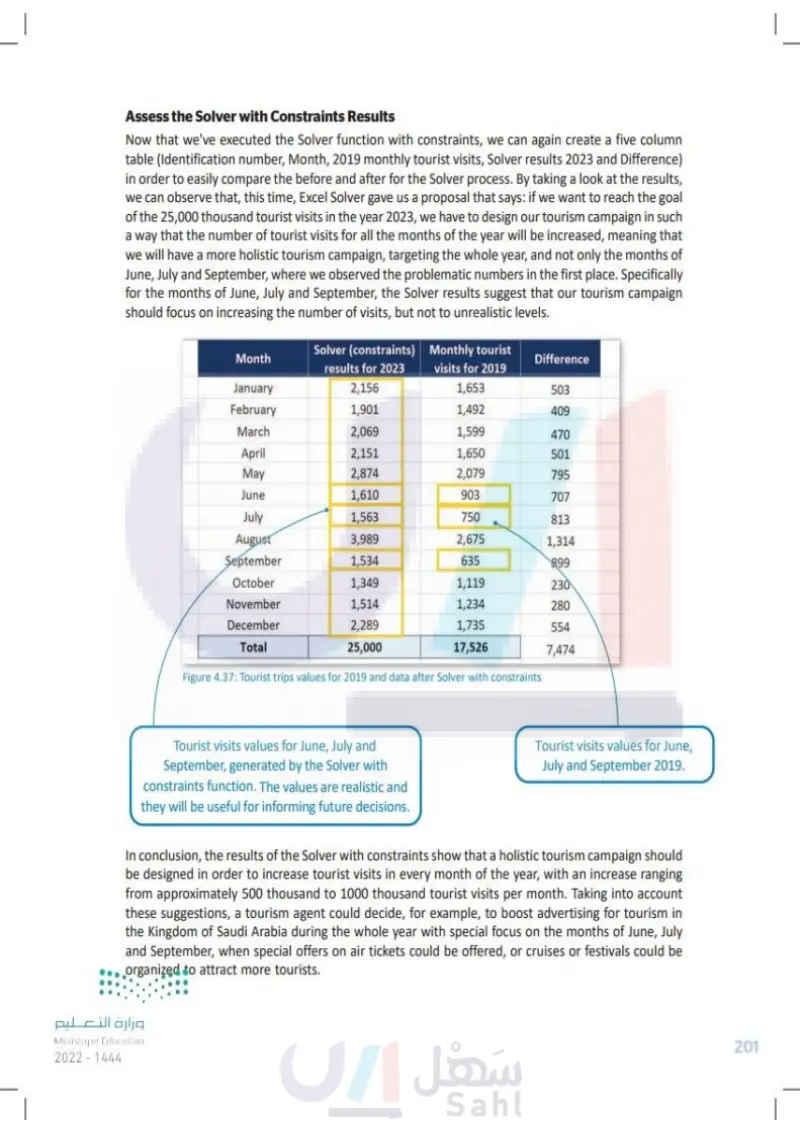
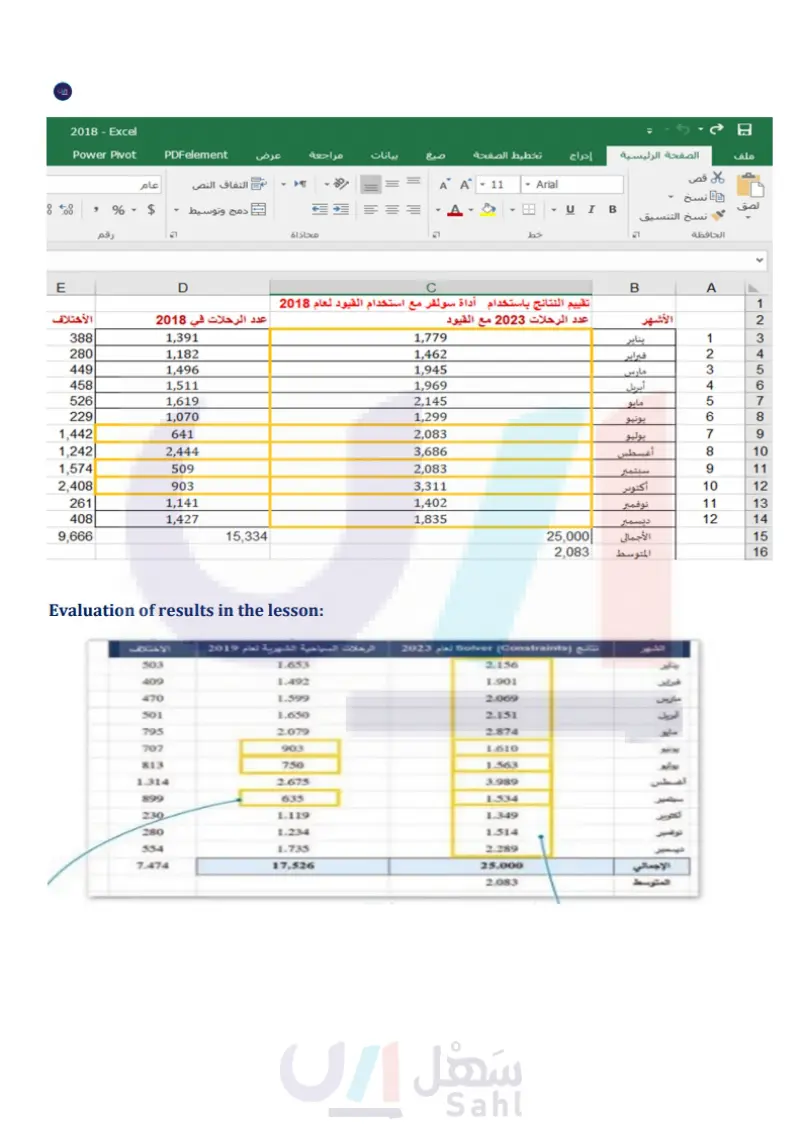
Assess the Solver with Constraints Results Now that we've executed the Solver function with constraints, we can again create a five column table (Identification number, Month, 2019 monthly tourist visits, Solver results 2023 and Difference) in order to easily compare the before and after for the Solver process. By taking a look at the results, we can observe that, this time, Excel Solver gave us a proposal that says: if we want to reach the goal of the 25,000 tourist visits in the year 2023, we have to design our tourism campaign in such a way that the number of tourist visits for all the months of the year will be increased, meaning that we will have a more holistic tourism campaign, targeting the whole year, and not only the months of June, July and September, where we observed the problematic numbers in the first place. Specifically for the months of June, July and September, the Solver results suggest that our tourism campaign should focus on increasing the number of visits, but not to unrealistic levels. Month Solver (constraints) results for 2023 Monthly tourist visits for 2019 Difference January 2,156 1,653 503 February 1,901 1,492 409 March 2,069 1,599 470 April 2,151 1,650 501 May 2,874 2,079 795 June 1,610 903 707 July 1,563 750 813 August 3,989 2,675 1,314 September 1,534 635 899 October 1,349 1,119 230 November 1,514 1,234 280 December 2,289 1,735 554 Total 25,000 17,526 7,474 Figure 4.37: Tourist trips values for 2019 and data after Solver with constraints Tourist visits values for June, July and September, generated by the Solver with constraints function. The values are realistic and they will be useful for informing future decisions. Tourist visits values for June, July and September 2019. In conclusion, the results of the Solver with constraints show that a holistic tourism campaign should be designed in order to increase tourist visits in every month of the year, with an increase ranging from approximately 500 to 1000 thousands of visits per month. Taking into account these suggestions, a tourism agent could decide, for example, to boost advertising for tourism in the Kingdom of Saudi Arabia during the whole year with special focus on the months of June, July and September, when special offers on air tickets could be offered, or cruises or festivals could be organized to attract more tourists. وزارة التعليم Ministry of Education 2024-1446 201

Assess the Solver with Constraints Results
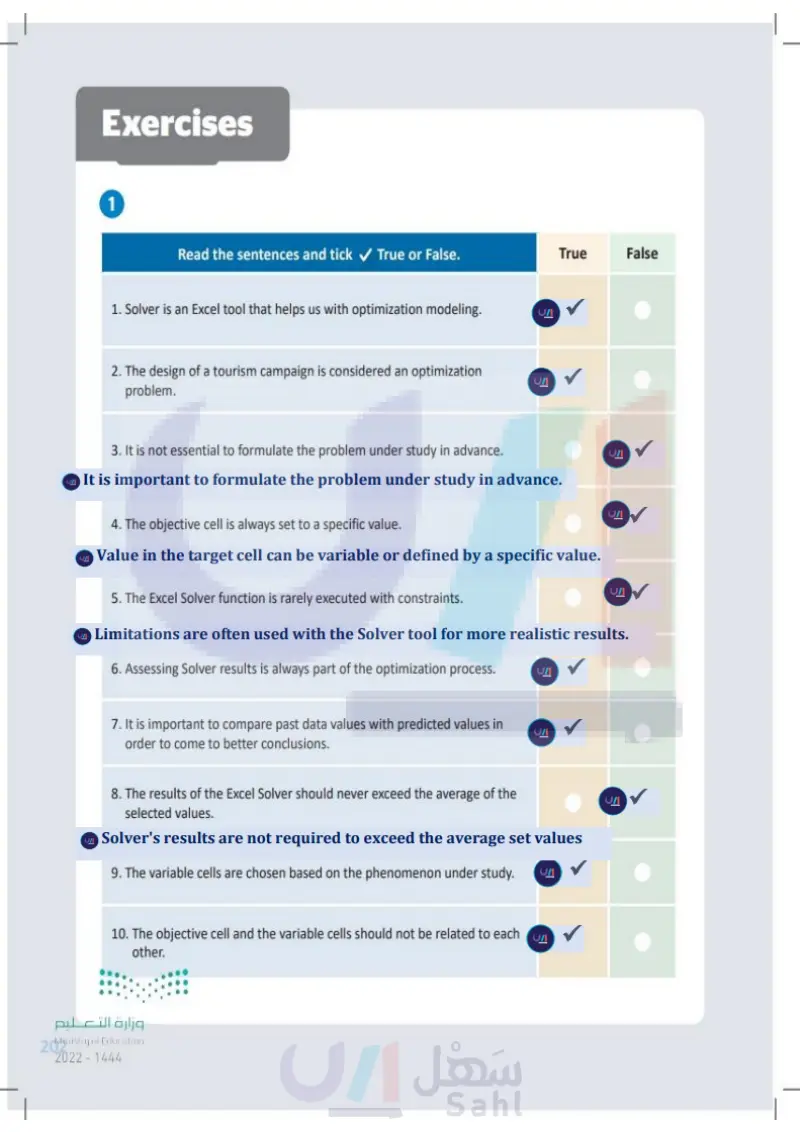
Exercises 1 Read the sentences and tick ✓ True or False. True False 1. Solver is an Excel tool that helps us with optimization modeling. 2. The design of a tourism campaign is considered an optimization problem. 3. It is not essential to formulate the problem under study in advance. 4. The objective cell is always set to a specific value. 5. The Excel Solver function is rarely executed with constraints. 6. Assessing Solver results is always part of the optimization process. 7. It is important to compare past data values with predicted values in order to come to better conclusions. 8. The results of the Excel Solver should never exceed the average of the selected values. 9. The variable cells are chosen based on the phenomenon under study. 10. The objective cell and the variable cells should not be related to each ...other. وزارة التعليم Ministry of Education 202 2024-1446

Read the sentences and tick True or False. Solver is an Excel tool that helps us with optimization modeling
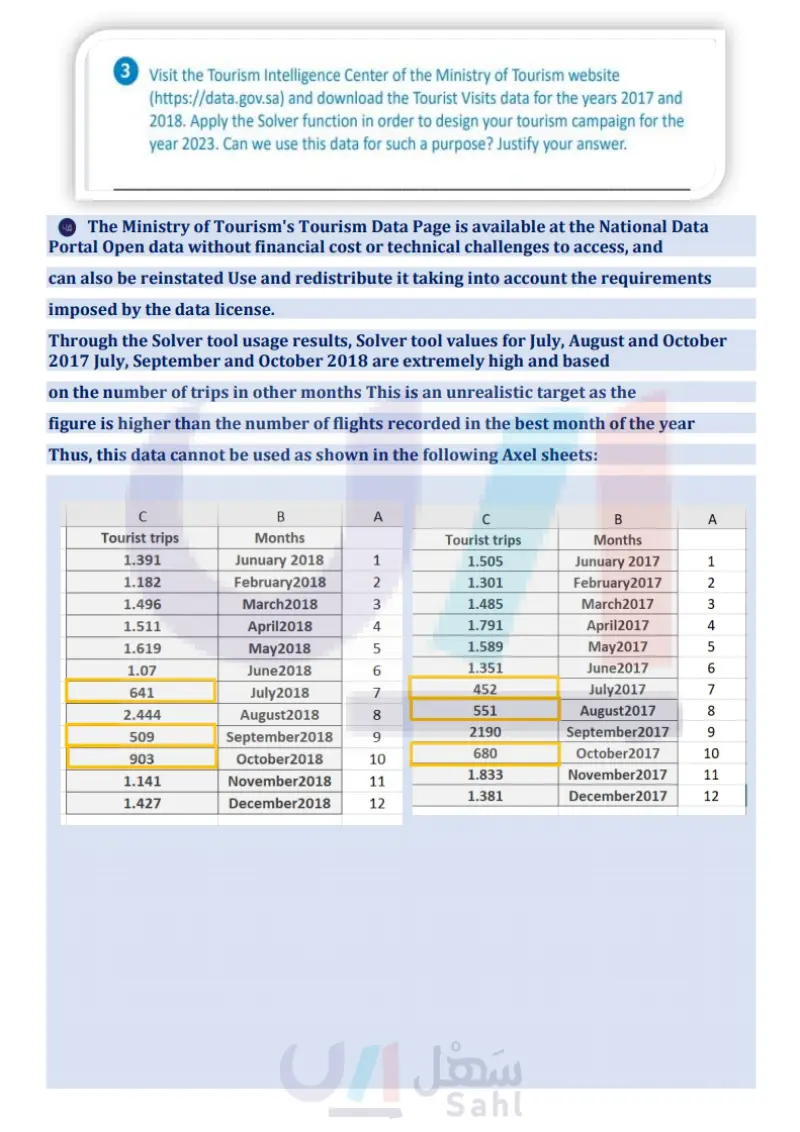
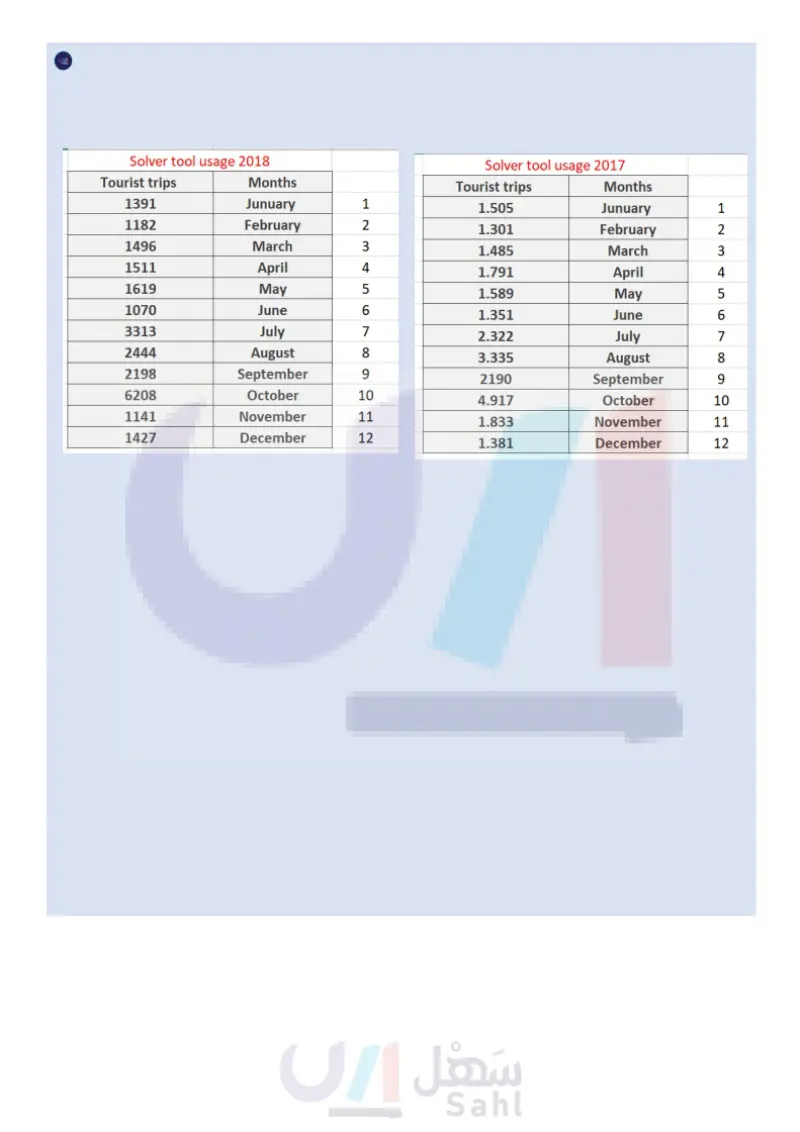
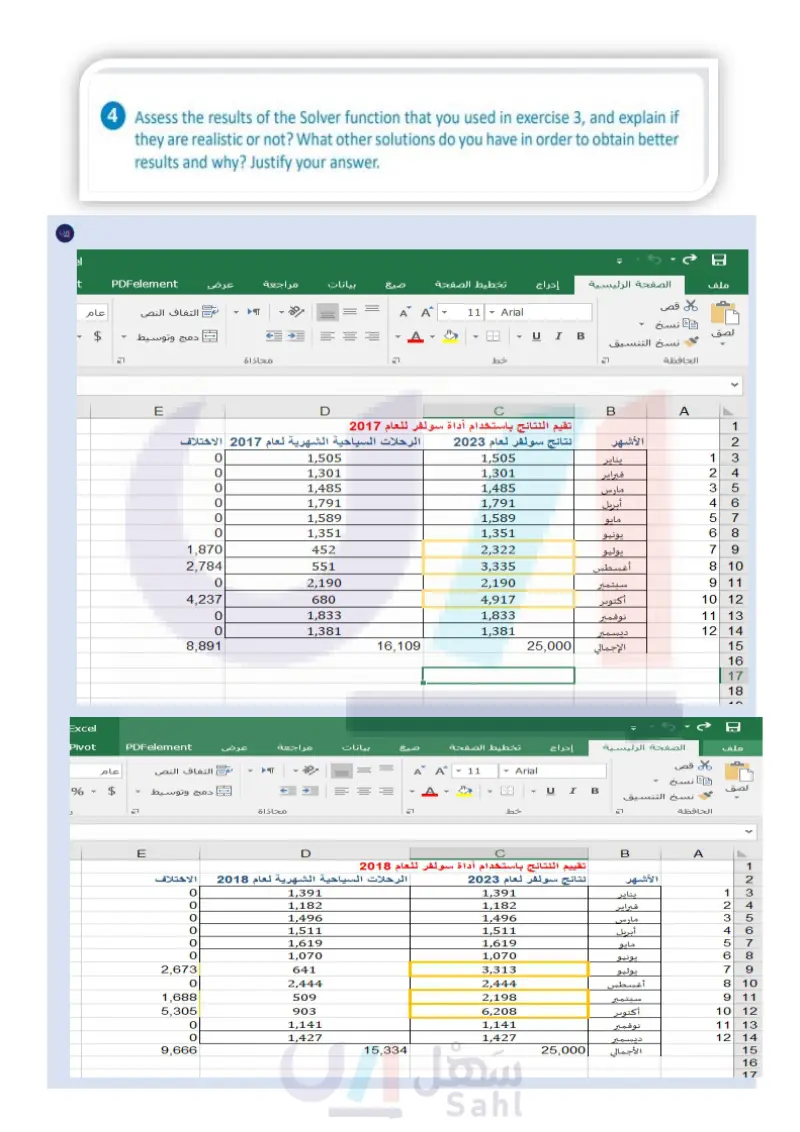
2 Compare the Solver function with no constraints and the Solver function with constraints. Write down two of their basic differences. 3 Visit the Tourism Intelligence Center of the Ministry of Tourism website (https://open.data.gov.sa) and download the Tourist Visits data for the years 2017 and 2018. Apply the Solver function in order to design your tourism campaign for the year 2023. Can we use this data for such a purpose? Justify your answer. وزارة التعليم Ministry of Education 2024 -1446 203

Apply the Solver function in order to design your tourism campaign for the year 2023. Can we use this data for such a purpose? Justify your answer
Compare the Solver function with no constraints and the Solver function with constraints. Write down two of their basic differences
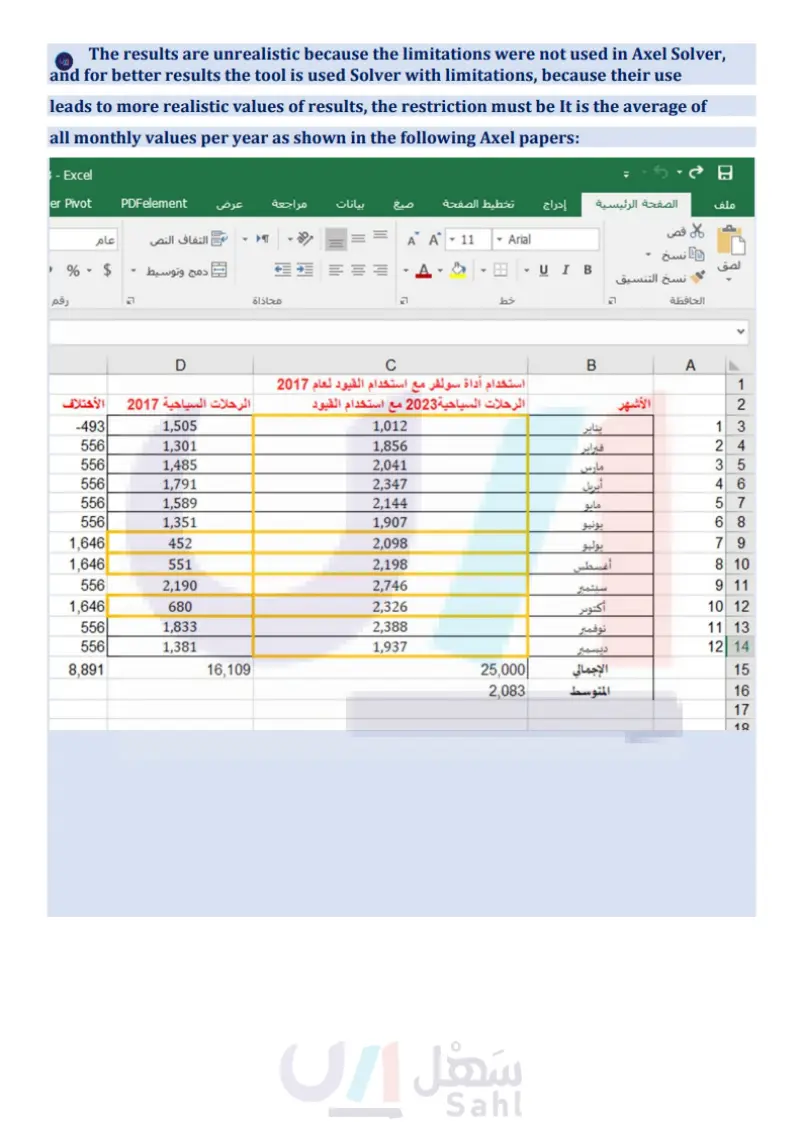
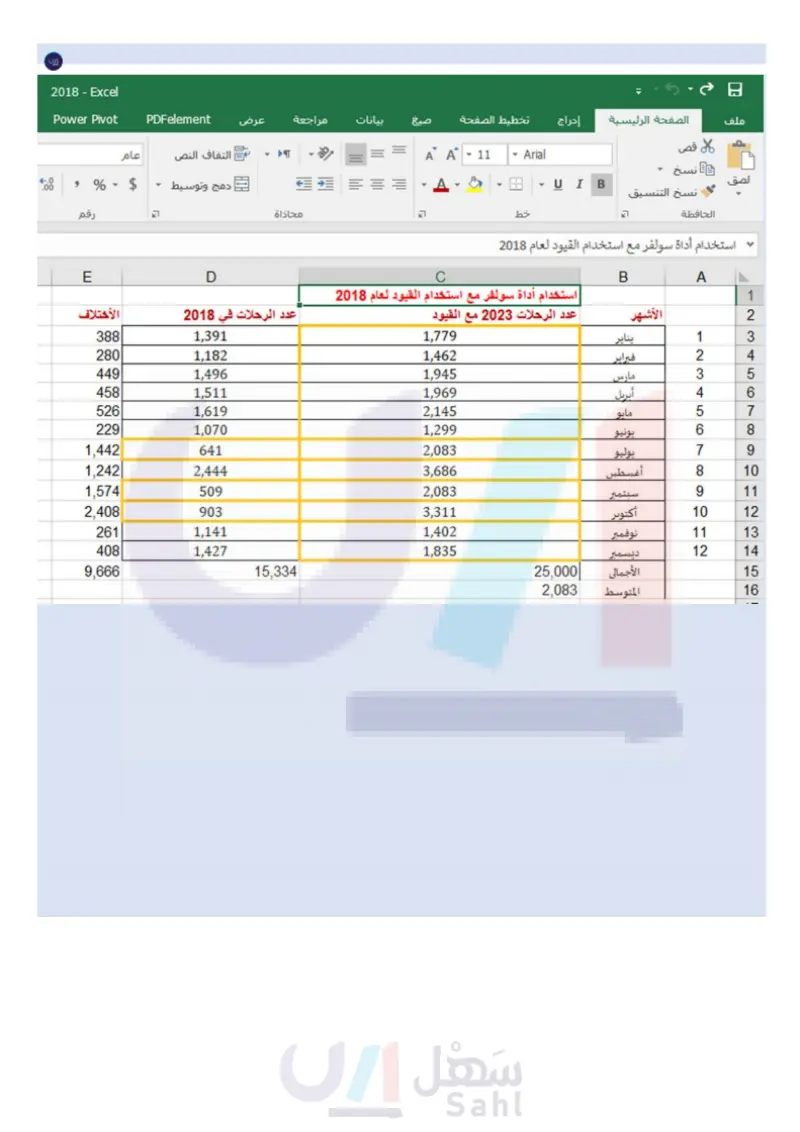
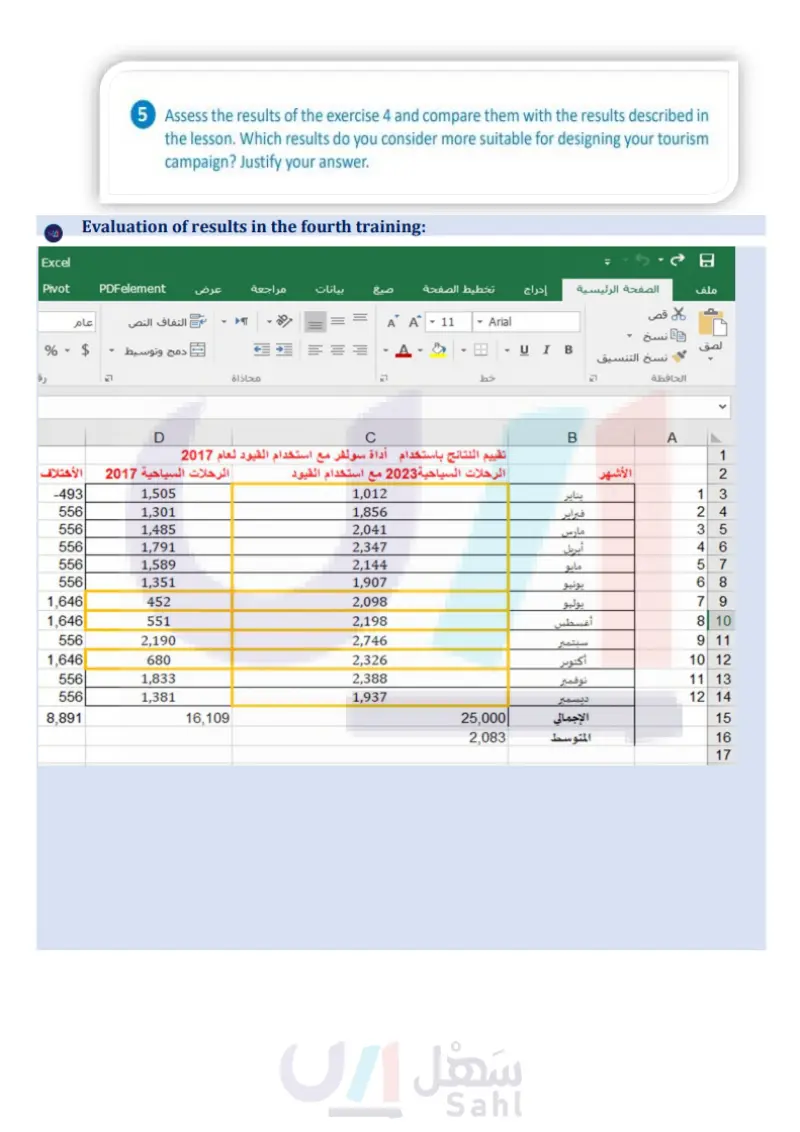
4 Assess the results of the Solver function that you used in exercise 3, and explain if they are realistic or not? What other solutions do you have in order to obtain better results and why? Justify your answer. 5 Assess the results of the exercise 4 and compare them with the results described in the lesson. Which results do you consider more suitable for designing your tourism campaign? Justify your answer. وزارة التعليم Ministry of Education 204 2024-1446

Assess the results of the exercise 4 and compare them with the results described in the lesson. Which results do you consider more suitable for designing your tourism campaign? Justify your
Assess the results of the Solver function that you used in exercise 3, and explain if they are realistic or not? What other solutions do you have in order to obtain better results and why? Ju


