


Python Libraries for Data Analysis - Data Science - ثاني ثانوي
1. Introduction to Data Science


2. Data Collection and Validation
3. Exploratory Data Analysis
4. Predictive data modeling and forecasting
1. Introduction to Data Science
2. Data Collection and Validation
3. Exploratory Data Analysis
4. Predictive data modeling and forecasting
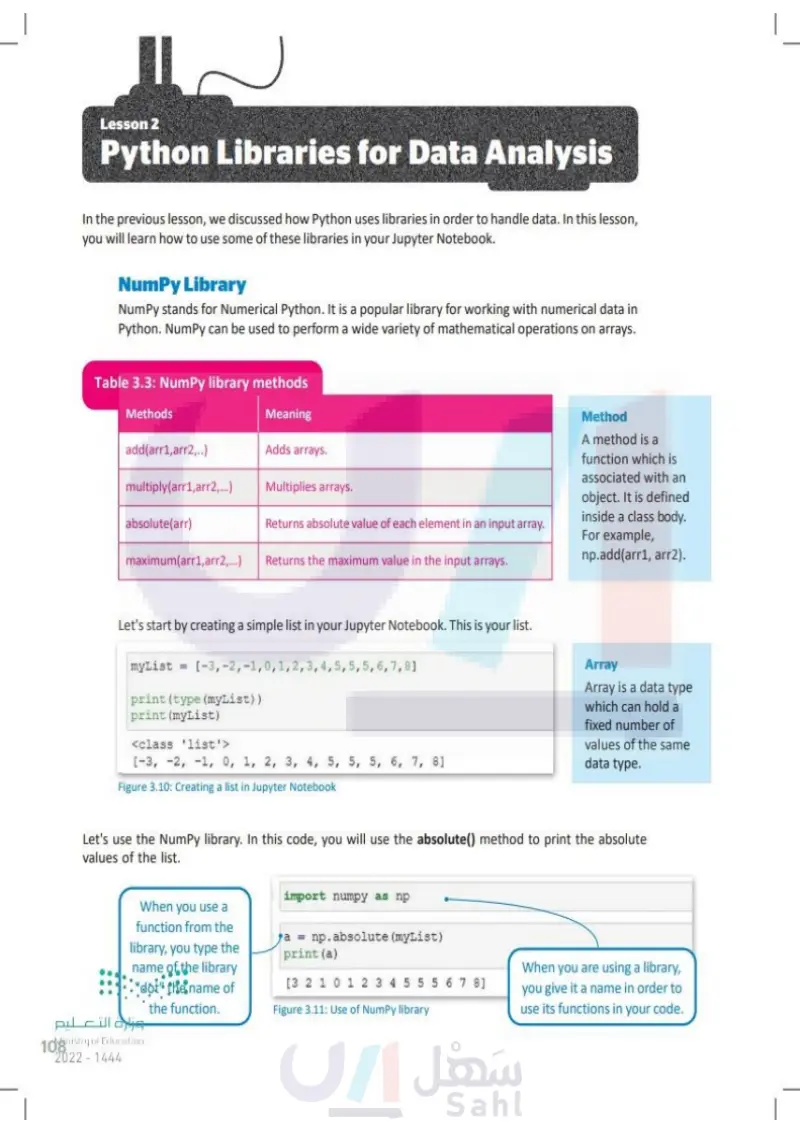
Lesson 2 Python Libraries for Data Analysis In the previous lesson, we discussed how Python uses libraries in order to handle data. In this lesson, you will learn how to use some of these libraries in your Jupyter Notebook. NumPy Library NumPy stands for Numerical Python. It is a popular library for working with numerical data in Python. NumPy can be used to perform a wide variety of mathematical operations on arrays. Table 3.3: NumPy library methods Methods Meaning add(arr1,arr2,..) Adds arrays. multiply(arr1, arr2,...) Multiplies arrays. absolute(arr) Returns the absolute value of each element in an input array. maximum(arr1, arr2,...) Returns the maximum value in the input arrays. Link to digital lesson www.ien.edu.sa Method A method is a function which is associated with an object. It is defined inside a class body. For example, np.add(arr1, arr2). Let's start by creating a simple list in your Jupyter notebook. This is your list. myList = [-3,-2,-1,0,1,2,3,4,5,5,5,6,7,8] print (type (myList)) print (myList) <class 'list'> [-3, -2, -1, 0, 1, 2, 3, 4, 5, 5, 5, 6, 7, 8] Figure 3.10: Creating a list in Jupyter Notebook Array An array is a data type which can hold a fixed number of values of the same data type. Let's use the NumPy library. In this code, you will use the absolute() method to print the absolute values of the list. When you use a function from the library, you type the name of the library "dot" the name of the function. import numpy as np a = np.absolute (myList) print (a) [3 2 1 0 1 2 3 4 5 5 5 6 7 8] Figure 3.11: Use of NumPy library العزارة التعليم Ministry of Education 108 2024-1446 When you are using a library, you give it a name in order to use its functions in your code.

Python Libraries for Data Analysis
NumPy Library
Table 3.3: NumPy library methods
Method
Array
Creating a list in Jupyter Notebook
Figure 3.11: Use of NumPy library
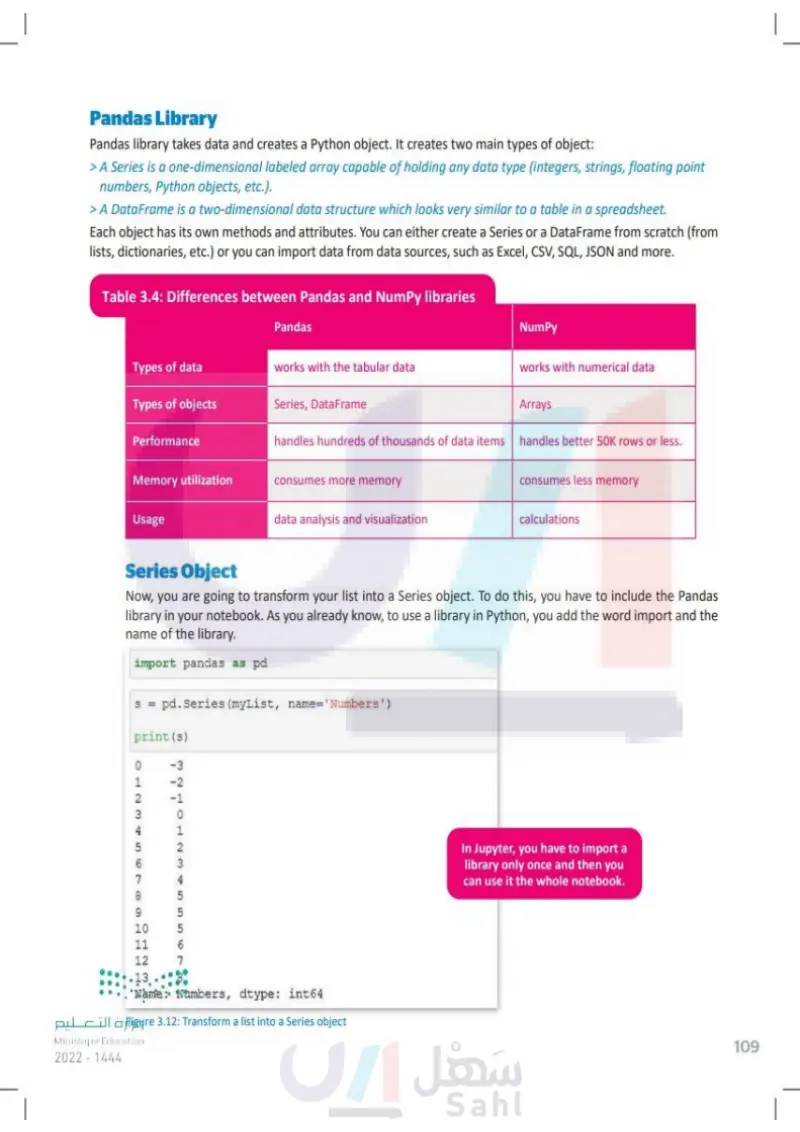
Pandas Library Pandas library takes data and creates a Python object. It creates two main types of object: > A Series is a one-dimensional labeled array capable of holding any data type (integers, strings, floating point numbers, Python objects, etc.). > A DataFrame is a two-dimensional data structure which looks very similar to a table in a spreadsheet. Each object has its own methods and attributes. You can either create a Series or a DataFrame from scratch (from lists, dictionaries, etc.) or you can import data from data sources, such as Excel, CSV, SQL, JSON and more. Table 3.4: Differences between Pandas and NumPy libraries Pandas NumPy Types of data works with tabular data works with numerical data Types of objects Series, DataFrame Arrays Performance handles hundreds of thousands of data items handles 50K rows or less Memory utilization consumes more memory consumes less memory Usage data analysis and visualization calculations The Series Object Now, you are going to transform your list into a Series object. To do this, you have to include the Pandas library in your notebook. As you already know, to use a library in Python, you add the word import and the name of the library. import pandas as pd s = pd.Series (myList, name='Numbers') Index وزارة التعليم Ministry of Education 2024-1446 MEHOTN45556 print(s) -3 -2 -1 0 1 2 3 0123456789 10 11 12 13 7 8 Series items Name: Numbers, dtype: int64 Figure 3.12: Transform a list into a Series object In Jupyter, you have to import a library only once and then you can use it the whole notebook. 109

Pandas Library
Differences between Pandas and NumPy libraries
Series Object
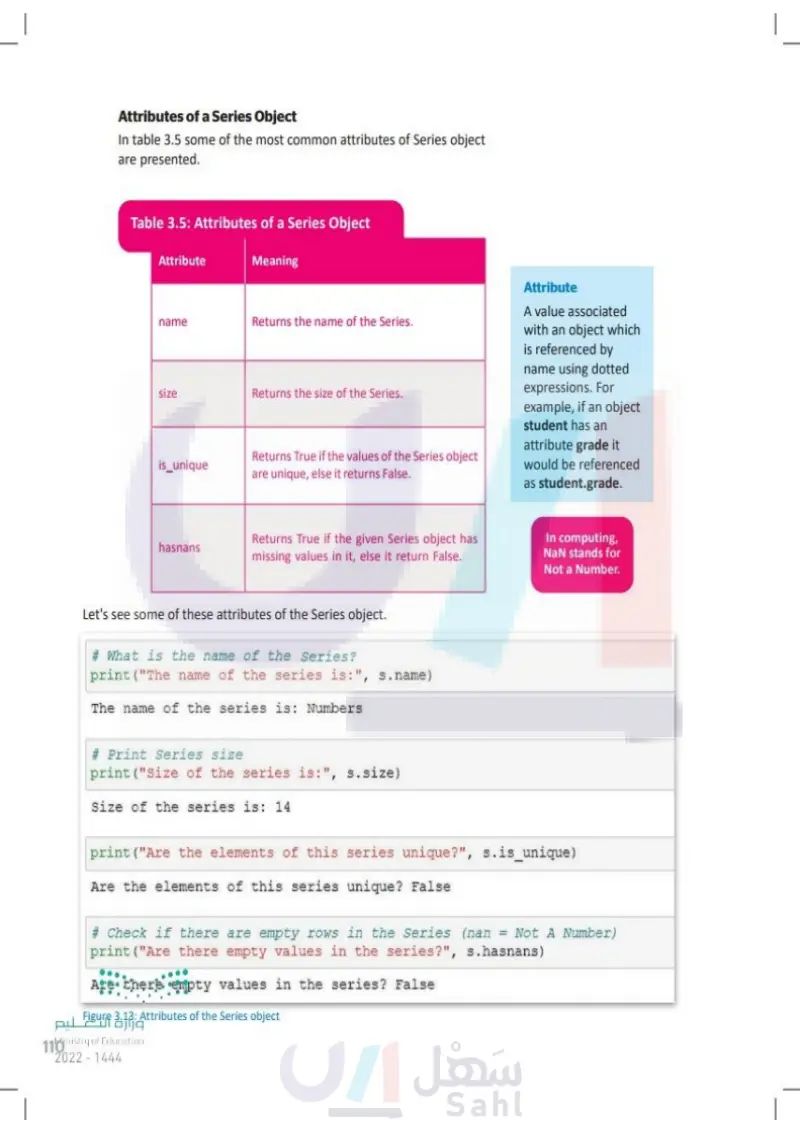
Attributes of a Series Object In table 3.5 some of the most common attributes of a Series object are presented. Table 3.5: Attributes of a Series Object Attribute Meaning name Returns the name of the Series. size is_unique Returns the size of the Series. Returns True if the values of the Series object are unique, else it returns False. Attribute A value associated with an object which is referenced by name using dotted expressions. For example, if an object student has an attribute grade it would be referenced as student.grade. hasnans Returns True if the given Series object has missing values in it, else it return False. Let's see some of these attributes of the Series object. # What is the name of the Series? print ("The name of the series is: ", s.name) The name of the series is: Numbers # Print Series size print ("Size of the series is:", s.size) Size of the series is: 14 In computing, NaN stands for Not a Number. print ("Are the elements of this series unique?", s.is_unique) Are the elements of this series unique? False # Check if there are empty rows in the Series (nan = Not A Number) print ("Are there empty values in the series?", s.hasnans) Are there empty values in the series? False وزارة التعليم Figure 3.13: Attributes of the Series object Ministry of Education 110 2024-1446

Attributes of a Series Object
Attributes of a Series Object
Attribute
In computing, NaN stands for Not a Number.
Let's see some of these attributes of the Series object
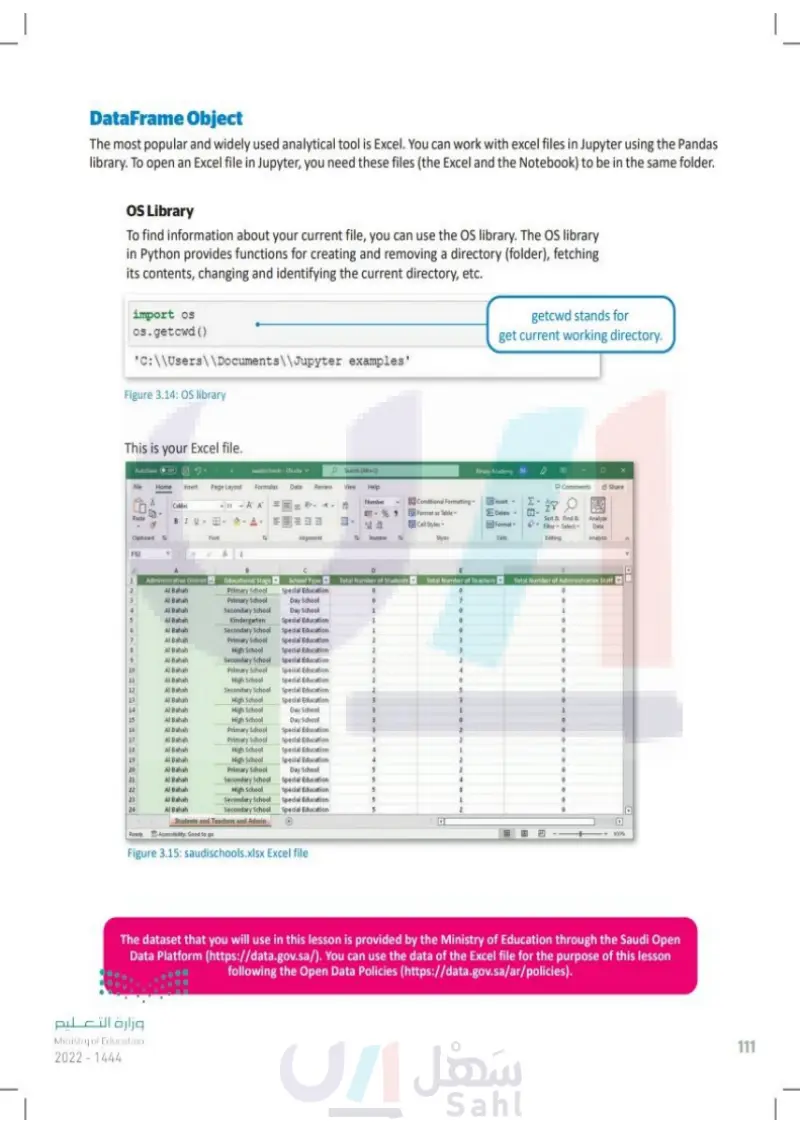
The DataFrame Object The most popular and widely used analytical tool is Excel. You can work with excel files in Jupyter using the Pandas library. To open an Excel file in Jupyter, you need these files (the Excel and the notebook) to be in the same folder. OS Library To find information about your current file, you can use the OS library. The OS library in Python provides functions for creating and removing a directory (folder), fetching its contents, changing and identifying the current directory, etc. import os os.getcwd () 'C:\\Users\\Documents\\Jupyter examples' getcwd stands for get current working directory. This is your Excel file. Figure 3.14: OS library AutoSave Off saudischools-EN.xlsx Search (Alt+Q) File Home Insert Page Layout Formulas Data Review View Calibri 11 A A Help Humber 1027-% Binary Academy BA X Comments Share Paste BIU Clipboard Font Conditional Formatting Format as Table Cell Styles Alignment Number Styles Insert- Delete- Format Cells Sort & Find & Filter-Select- Editing Analyze Data Analysis F92 Administrative District- Al Bahah 9 3456789 Al Bahah 4. Al Bahah Educational Stage Primary School Primary School Secondary School School Type Special Education Day School Total Number of Students Total Number of Teachers Total Number of Administrative Staff 0 0 Day School I 0 1 Al Bahah Al Bahah Kindergarten Secondary School Special Education 1 0 0 Special Education 1 0 0 Al Bahah Primary School Special Education 2 3 0 Al Bahah High School Special Education 2 3 0 Al Bahah Secondary School Special Education 2 2 0 10 Al Bahah Primary School Special Education 2 4 0 11 Al Bahah High School Special Education 2 O 0 12 Al Bahah Secondary School Special Education 2 5 0 13 Al Bahah High School Special Education 3 3 0 14 Al Bahah High School Day School 3 1 1 15 Al Bahah High School Day School 3 0 0 16 Al Bahah Primary School Special Education 3 2 0 17 Al Bahah Primary School Special Education 3 2 0 18 Al Bahah High School Special Education 4 1 0 19 Al Bahah High School Special Education 4 2 0 20 Al Bahah Primary School Day School 5 2 0 21 Al Bahah 22 Al Bahah 23 Al Bahah 24 Al Bahah Secondary School High School Secondary School Secondary School Special Education 5 4 0 Special Education 5 8 0 Special Education 5 1 ° Special Education 2 0 Students and Teachers and Admin Ready Accessibility: Good to go E Figure 3.15: saudischools.xlsx Excel file 100% The dataset that you will use in this lesson is provided by the Ministry of Education through the Open Data Platform (https://open.data.gov.sa/). You can use the data of the Excel file for the purpose of this lesson following the Open Data Policies (https://open.data.gov.sa/en/pages/policies/license). وزارة التعليم Ministry of Education 2024-1446 111

DataFrame Object
OS Library
OS library
This is your Excel file
The dataset that you will use in this lesson is provided by the Ministry of Education through the Saudi Open Data Platform
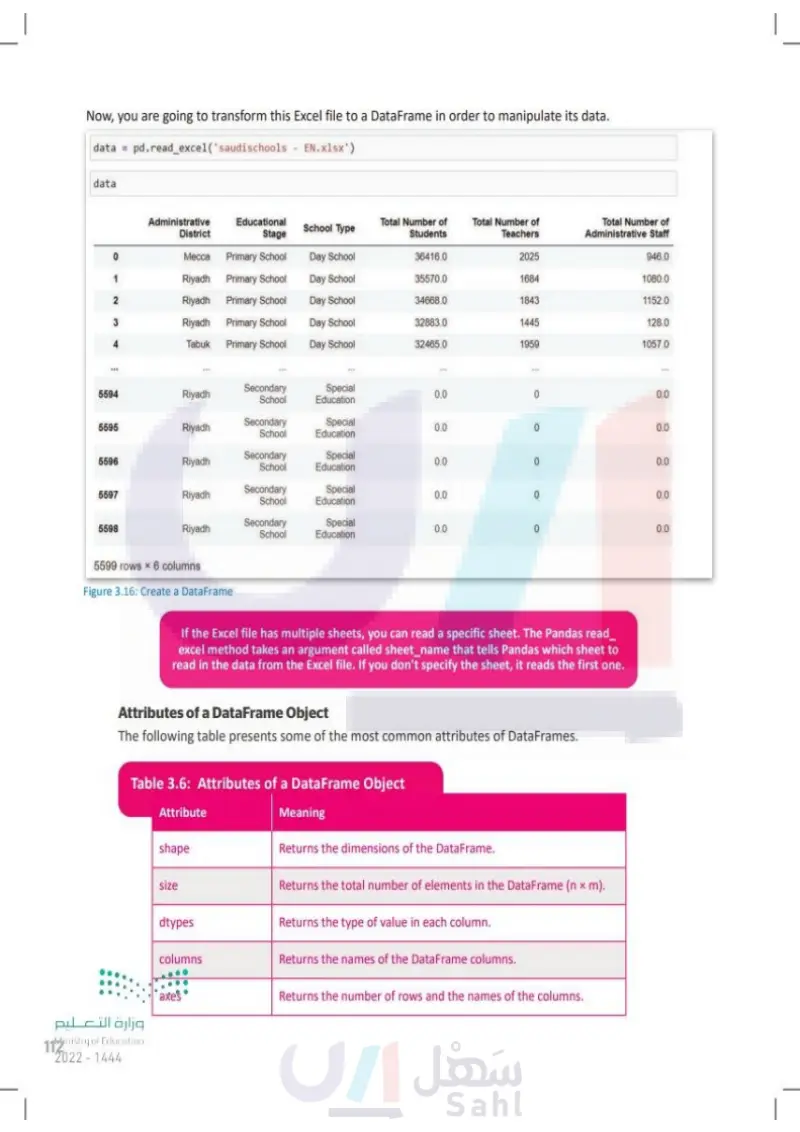
Now, you are going to transform this Excel file to a DataFrame in order to manipulate its data. data = pd.read_excel('saudischools - EN.xlsx') data Administrative District Educational Stage School Type Total Number of Students Total Number of Teachers Total Number of Administrative Staff 0 Mecca Primary School Day School 36416.0 2025 946.0 1 Riyadh Primary School Day School 35570.0 1684 1080.0 2 Riyadh Primary School Day School 34668.0 1843 1152.0 3 Riyadh Primary School Day School 32883.0 1445 128.0 4 Tabuk Primary School Day School 32465.0 1959 1057.0 5594 Riyadh 5595 Riyadh 5596 Riyadh Secondary School Secondary School Secondary School Special Education 0.0 Special 0.0 Education Special 0.0 Education 5597 Riyadh 5598 Riyadh Secondary School Secondary School Special 0.0 Education Special Education 0.0 0 5599 rows x6 columns 0.0 In order to open an Excel file in Jupyter Notebook, both the Excel file and the Jupyter Notebook file should be saved in the same folder. Figure 3.16: Create a DataFrame If the Excel file has multiple sheets, you can read a specific sheet. The Pandas read_ excel method takes an argument called sheet_name that tells Pandas which sheet to read in the data from the Excel file. If you don't specify the sheet, it reads the first one. Attributes of a DataFrame Object The following table presents some of the most common attributes of DataFrames. Table 3.6: Attributes of a DataFrame Object وزارة التعليم Ministry of Education 112 2024-1446 Attribute Meaning shape Returns the dimensions of the DataFrame. size Returns the total number of elements in the DataFrame (n × m). dtypes Returns the type of value in each column. columns Returns the names of the DataFrame columns. axes Returns the number of rows and the names of the columns.

Now, you are going to transform this Excel file to a DataFrame in order to manipulate its data
Attributes of a DataFrame Object
Attributes of a DataFrame Object
If the Excel file has multiple sheets, you can read a specific sheet.
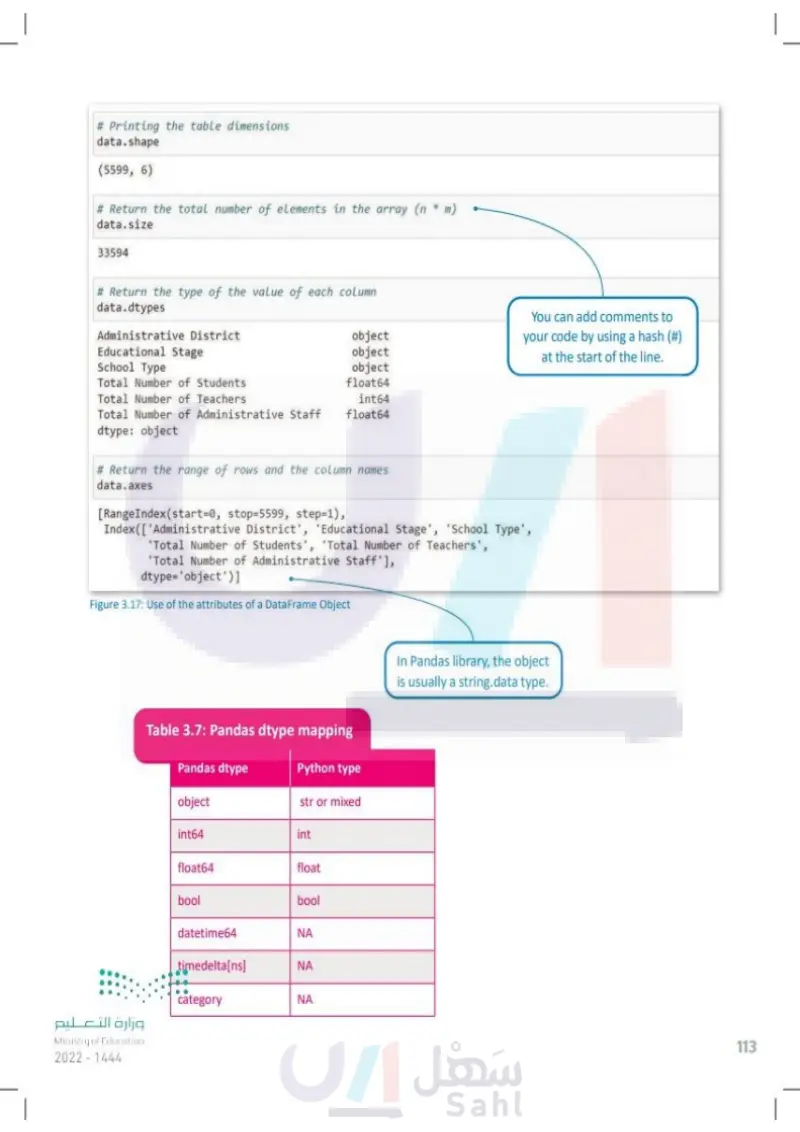
# Printing the table dimensions data.shape (5599, 6) # Return the total number of elements in the array (n * m) data.size 33594 # Return the type of the value of each column data.dtypes Administrative District object Educational Stage object School Type object Total Number of Students float64 Total Number of Teachers int64 Total Number of Administrative Staff float64 dtype: object You can add comments to your code by using a hash (#) at the start of the line. Comments are statements that are not executed, rather they make the code more readable. # Return the range of rows and the column names data.axes [RangeIndex(start=0, stop-5599, step-1), Index(['Administrative District', 'Educational Stage', 'School Type', 'Total Number of Students', 'Total Number of Teachers', 'Total Number of Administrative Staff'], dtype='object')] Figure 3.17: Use of the attributes of a DataFrame Object Table 3.7: Pandas dtype mapping وزارة التعليم Ministry of Education 2024-1446 Pandas dtype Python type object str or mixed int64 int float64 float bool bool datetime64 ΝΑ timedelta[ns] ΝΑ category ΝΑ In Pandas library, the object is usually a string.data type. 113

Pandas dtype mapping
Use of the attributes of a DataFrame Object
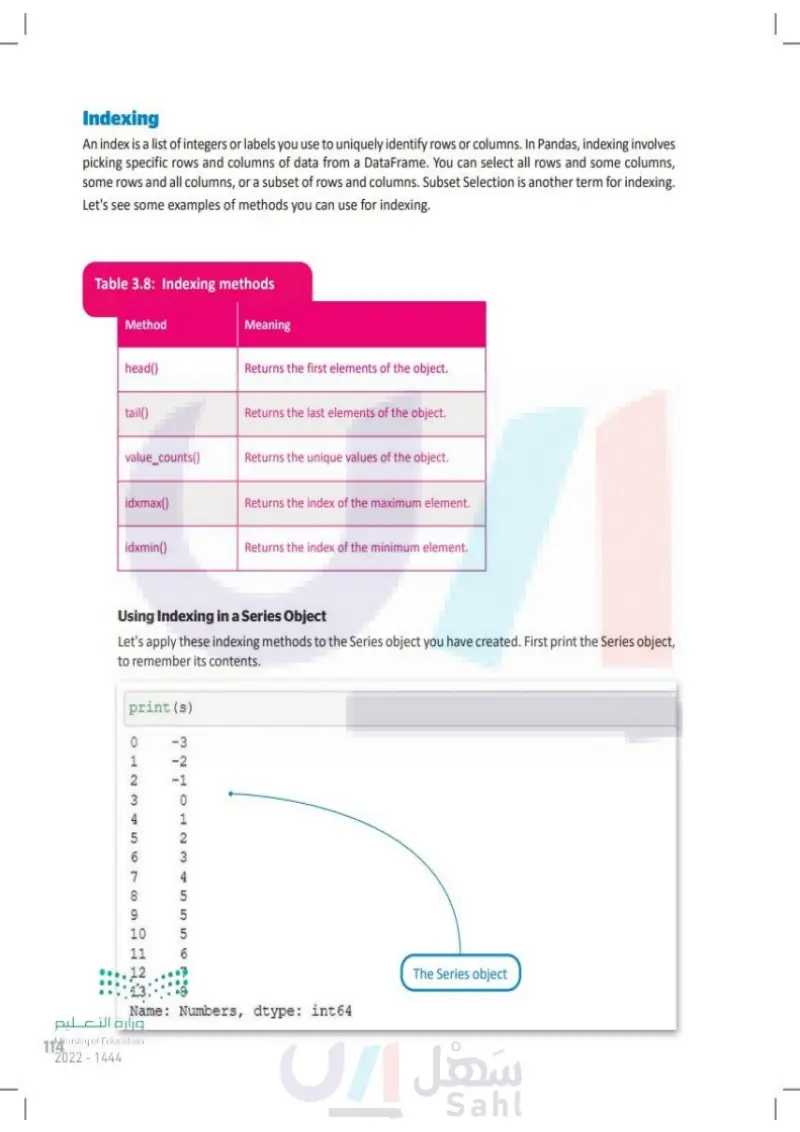
Indexing An index is a list of integers or labels you use to uniquely identify rows or columns. In Pandas, indexing involves picking specific rows and columns of data from a DataFrame. You can select all rows and some columns, some rows and all columns, or a subset of rows and columns. Subset Selection is another term for indexing. Let's see some examples of methods you can use for indexing. Table 3.8: Indexing methods Method Meaning head() Returns the first elements of the object. tail() Returns the last elements of the object. value_counts() Returns unique values and their counts. idxmax() Returns the index of the maximum element. idxmin() Returns the index of the minimum element. Using Indexing in a Series Object Let's apply these indexing methods to the Series object you have created. First print the Series object, to remember its contents. print(s) 0 -3 1 -2 2 -1 ANW 3 0 4 1 5 2 6 3 7 4 8 5 9 5 10 5 11 12. 13 Name: Numbers, dtype: int64 The Series object وزارة التعليم Ministry of Education 114 2024-1446

Indexing
Indexing methods
Using Indexing in a Series Object
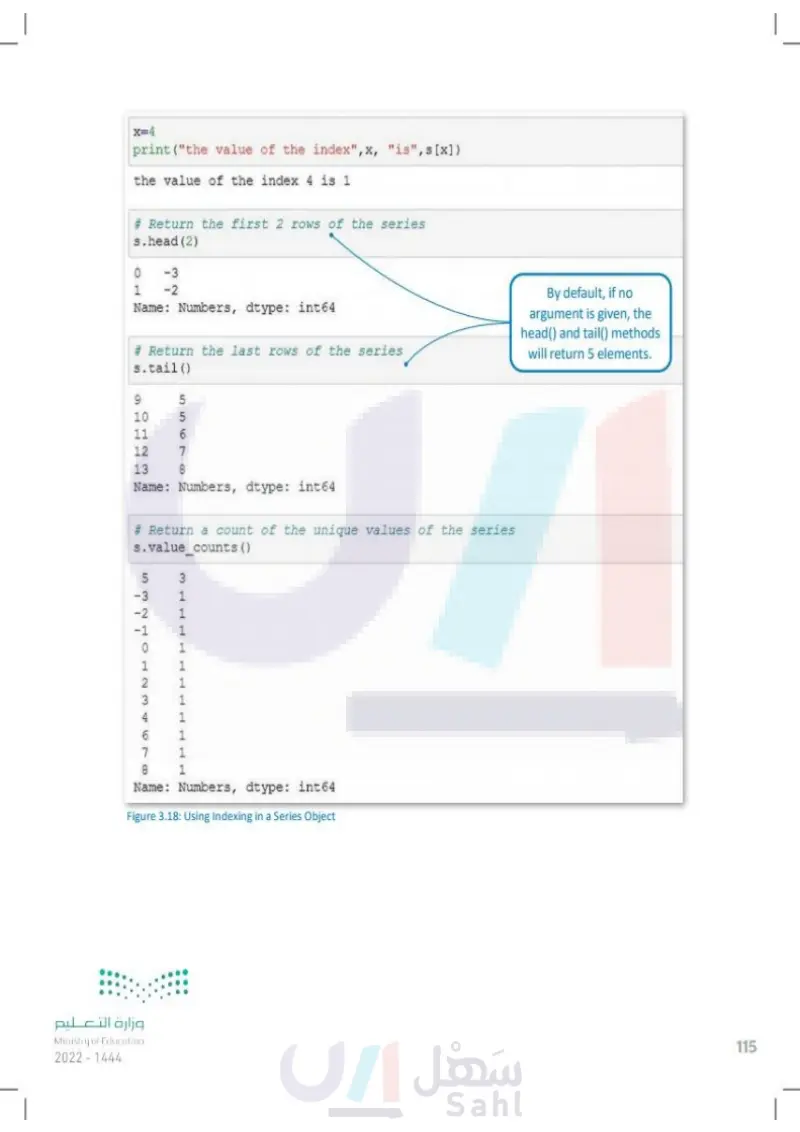
x=4 print ("the value of the index", x, "is", s [x]) the value of the index 4 is 1 # Return the first 2 rows of the series s.head (2) 0 1 -3 -2 Name: Numbers, dtype: int64 # Return the last rows of the series s.tail () 9 ΟΥ 10 11 556 5 5 6 12 13 7 8 Name: Numbers, dtype: int64 # Return a count of the unique values of the series s.value_counts () 5 3 -3 1 -2 1 -1 1 0 1 1 1 2 1 3 1 4 6 7 1 8 1 Name: Numbers, dtype: int64 Figure 3.18: Using Indexing in a Series Object وزارة التعليم Ministry of Education 2024-1446 By default, if no argument is given, the head() and tail() methods will return 5 elements. 115

Using Indexing in a Series Object
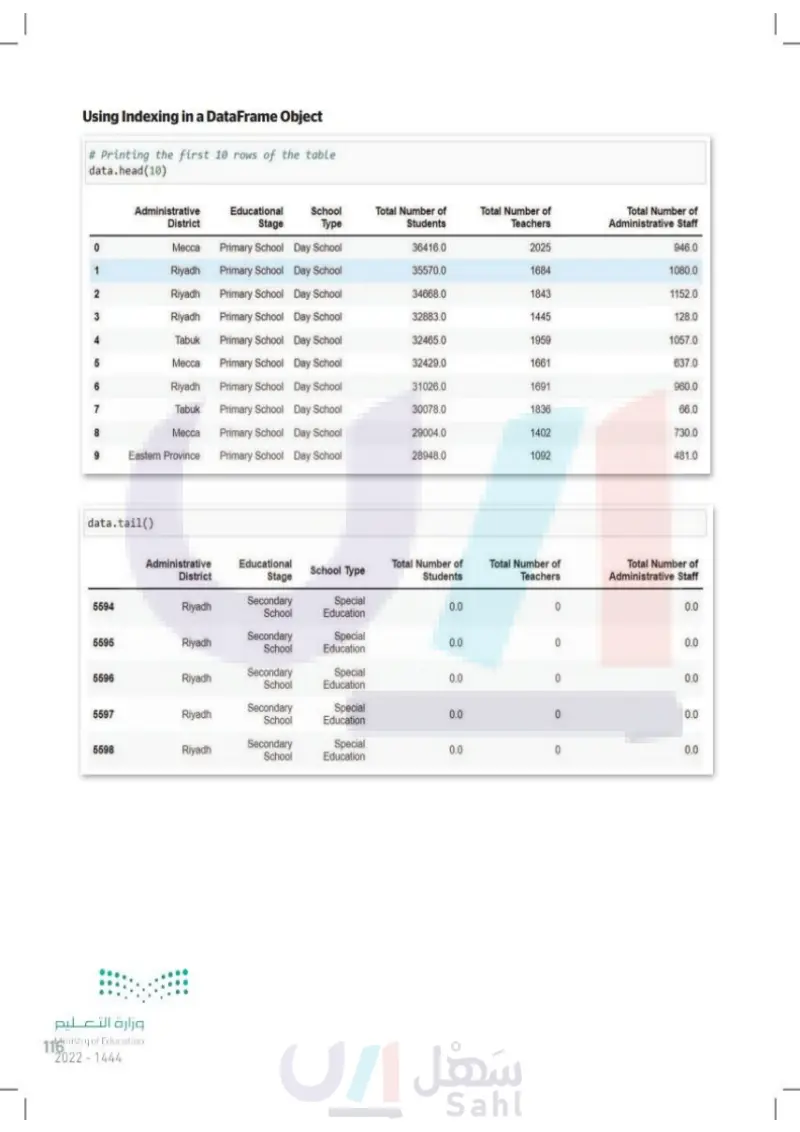
Using Indexing in a DataFrame Object # Printing the first 10 rows of the table data.head(10) Administrative District Educational Stage School Type Total Number of Students Total Number of Teachers Total Number of Administrative Staff 0 Месса Primary School Day School 36416.0 2025 946.0 1 Riyadh Primary School Day School 35570.0 1684 1080.0 2 Riyadh Primary School Day School 34668.0 1843 1152.0 3 Riyadh Primary School Day School 32883.0 1445 128.0 4 Tabuk Primary School Day School 32465.0 1959 1057.0 5 Месса Primary School Day School 32429.0 1661 637.0 6 Riyadh Primary School Day School 31026.0 1691 960.0 7 Tabuk Primary School Day School 30078.0 1836 66.0 8 9 Месса Eastern Province Primary School Day School 29004.0 1402 730.0 Primary School Day School 28948.0 1092 481.0 data.tail() Administrative District 5594 Riyadh 5595 Riyadh 5596 Riyadh 5597 Riyadh Educational Stage Secondary School Secondary School Secondary School Secondary School School Type Total Number of Students Total Number of Teachers Total Number of Administrative Staff Special Education 0.0 0 0.0 Special Education 0.0 0 0.0 Special 0.0 0 0.0 Education Special Education 0.0 0 0.0 5598 Riyadh Secondary School Special 0.0 0 0.0 Education وزارة التعليم Ministry of Education 116 2024-1446

Using Indexing in a DataFrame Object
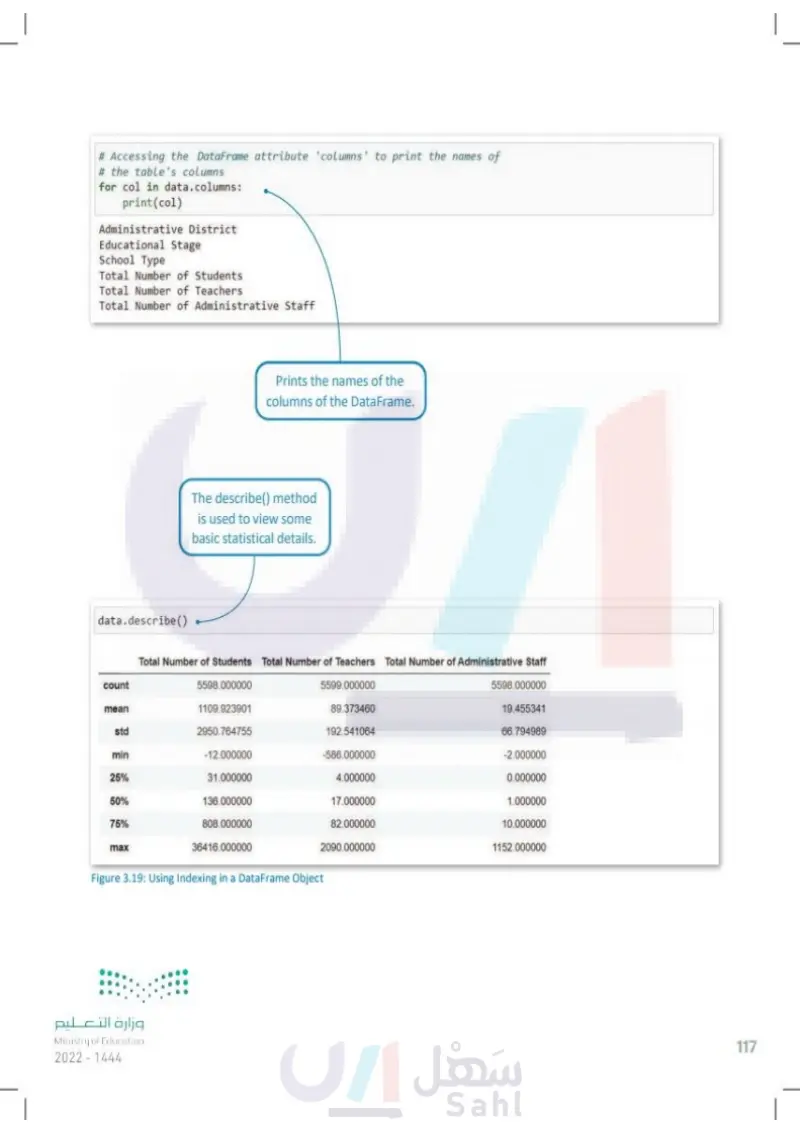
# Accessing the DataFrame attribute 'columns' to print the names of # the table's columns for col in data.columns: print(col) Administrative District Educational Stage School Type Total Number of Students Total Number of Teachers Total Number of Administrative Staff data.describe() Prints the names of the columns of the DataFrame. The describe() method is used to view some basic statistical details. Total Number of Students Total Number of Teachers Total Number of Administrative Staff count 5598.000000 5599.000000 5598.000000 mean 1109.923901 89.373460 19.455341 std 2950.764755 192.541064 66.794989 min -12.000000 -586.000000 -2.000000 25% 31.000000 4.000000 0.000000 50% 136.000000 17.000000 1.000000 75% 808.000000 82.000000 10.000000 max 36416.000000 2090.000000 1152.000000 وزارة التعليم Ministry of Education 2024-1446 Figure 3.19: Using Indexing in a DataFrame Object 117

Figure 3.19: Using Indexing in a DataFrame Object
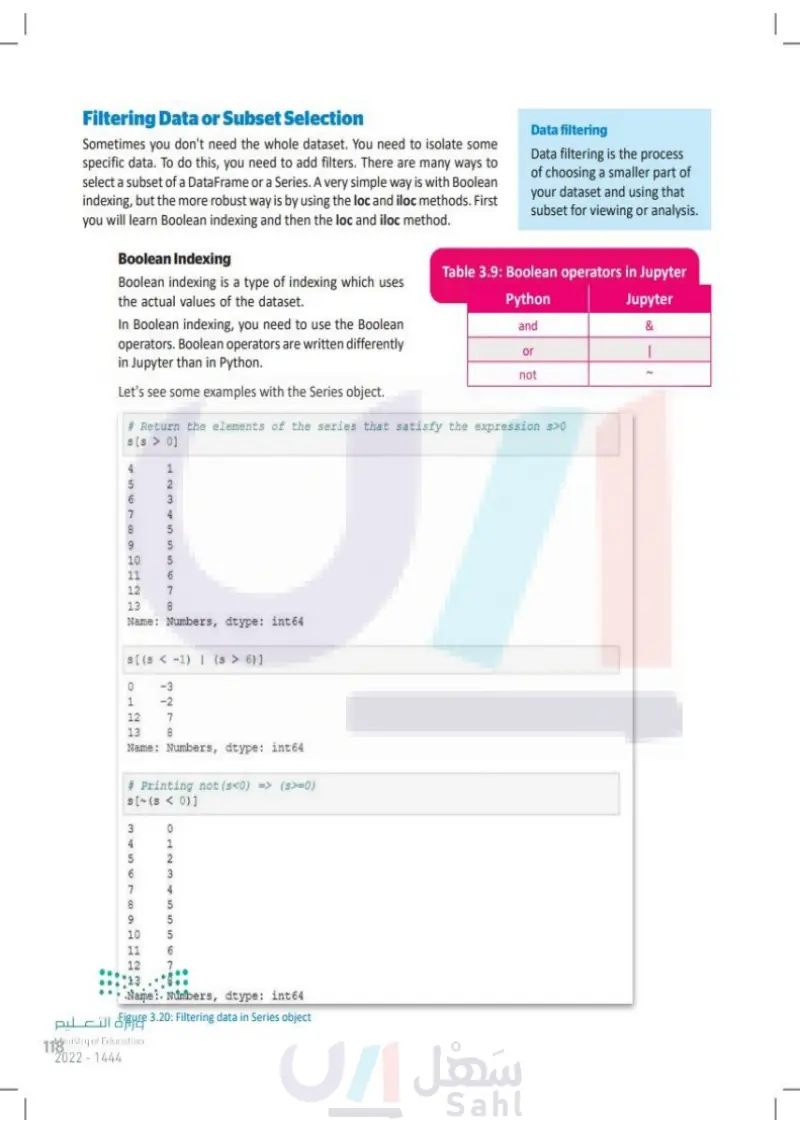
Filtering Data or Subset Selection Sometimes you don't need the whole dataset. You need to isolate some specific data. To do this, you need to add filters. There are many ways to select a subset of a DataFrame or a Series. A very simple way is with Boolean indexing, but the more robust way is by using the loc and iloc methods. First you will learn Boolean indexing and then the loc and iloc method. Boolean Indexing Boolean indexing is a type of indexing which uses the actual values of the dataset. In Boolean indexing, you need to use the Boolean operators. Boolean operators are written differently in Jupyter than in Python. Let's see some examples with the Series object. Data filtering Data filtering is the process of choosing a smaller part of your dataset and using that subset for viewing or analysis. Table 3.9: Boolean operators in Jupyter Python and Jupyter & or | not # Return the elements of the series that satisfy the expression s>0 s [s > 0] 456789 6 7 10 5 11 12 7 13 8 12345555670 1 2 Name: Numbers, dtype: int64 s[(s<-1) | (s > 6)] 0 -3 1 -2 12 7 13 8 Name: Numbers, dtype: int64 # Printing not (s<0) => (s>=0) s[~(s< 0)] 34567891 0 1 5 10 70 11 12 5 6 072345556 3 4 5 13 Name: Numbers, dtype: int64 وزارة التعليم Ministry of Education 118 2024-1446 Figure 3.20: Filtering data in Series object

Let's see some examples with the Series object
Data filtering
Filtering Data or Subset Selection
Boolean operators in Jupyter
Boolean Indexing
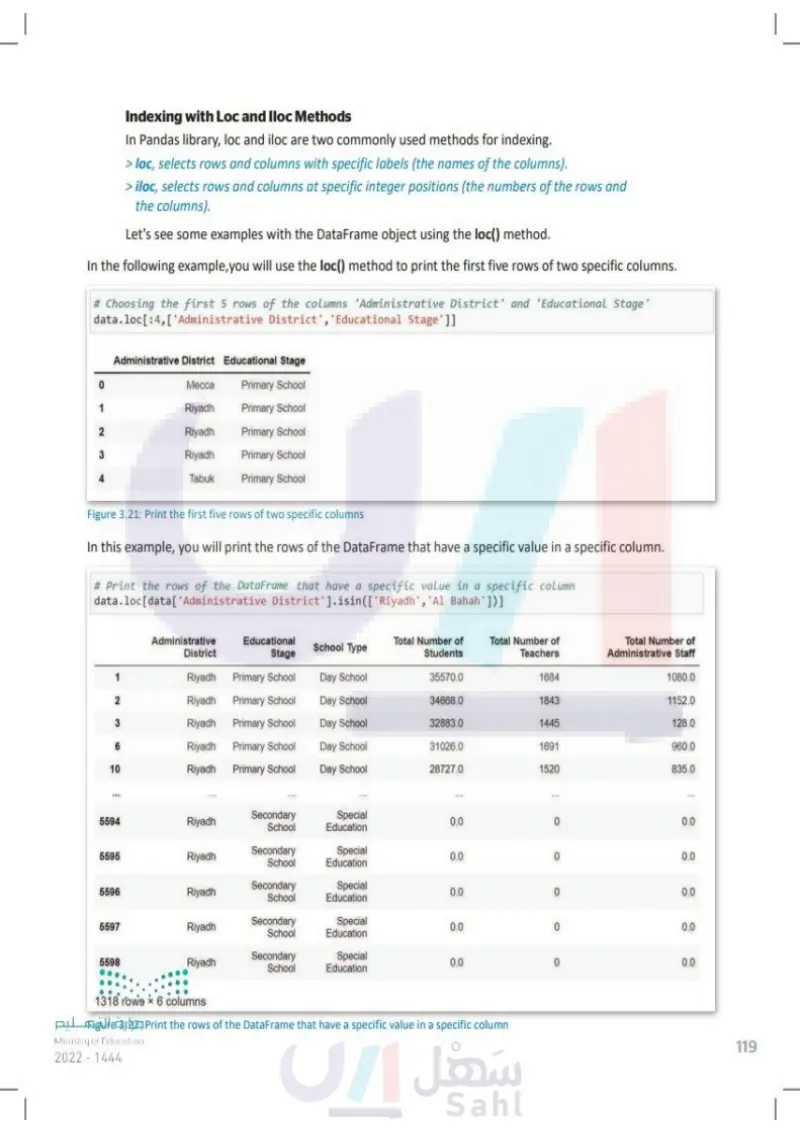
Indexing Loc and lloc Methods In Pandas library, loc and iloc are two commonly used methods for indexing. > loc selects rows and columns with specific labels (the names of the columns). > iloc selects rows and columns at specific integer positions (the numbers of the rows and the columns). Let's see some examples with the DataFrame object using the loc() method. In the following example, you will use the loc() method to print the first five rows of two specific columns. # Choosing the first 5 rows of the columns 'Administrative District' and 'Educational Stage' data.loc[:4, ['Administrative District', 'Educational Stage']] Administrative District Educational Stage 0 Месса Primary School 1 Riyadh Primary School 2 Riyadh Primary School 3 Riyadh Primary School 4 Tabuk Primary School Figure 3.21: Print the first five rows of two specific columns In this example, you will print the rows of the DataFrame that have a specific value in a specific column. # Print the rows of the DataFrame that have a specific value in a specific column data.loc[data['Administrative District'].isin(['Riyadh', 'Al Bahah'])] Administrative District Educational Stage School Type Total Number of Students Total Number of Total Number of Teachers Administrative Staff Riyadh Primary School Day School 35570.0 1684 1080.0 2 Riyadh Primary School Day School 34668.0 1843 1152.0 3 Riyadh Primary School Day School 32883.0 1445 128.0 6 Riyadh Primary School Day School 31026.0 1691 960.0 10 Riyadh Primary School Day School 28727.0 1520 835.0 5594 Riyadh 5595 Riyadh 5596 Riyadh 5597 Riyadh 5598 Riyadh Secondary School Secondary School Secondary School Secondary School Secondary School Special Education 0.0 0 0.0 Special 0.0 0 0.0 Education Special 0.0 0 0.0 Education Special Education 0.0 0 0.0 Special Education 0.0 0 0.0 1318 rows x6 columns وزارة التعليم Figure 3.22: Print the rows of the DataFrame that have a specific value in a specific column Ministry of Education 2024-1446 119

In this example, you will print the rows of the DataFrame that have a specific value in a specific column
In the following example,you will use the loc() method to print the first five rows of two specific columns
Indexing with Loc and Iloc Methods
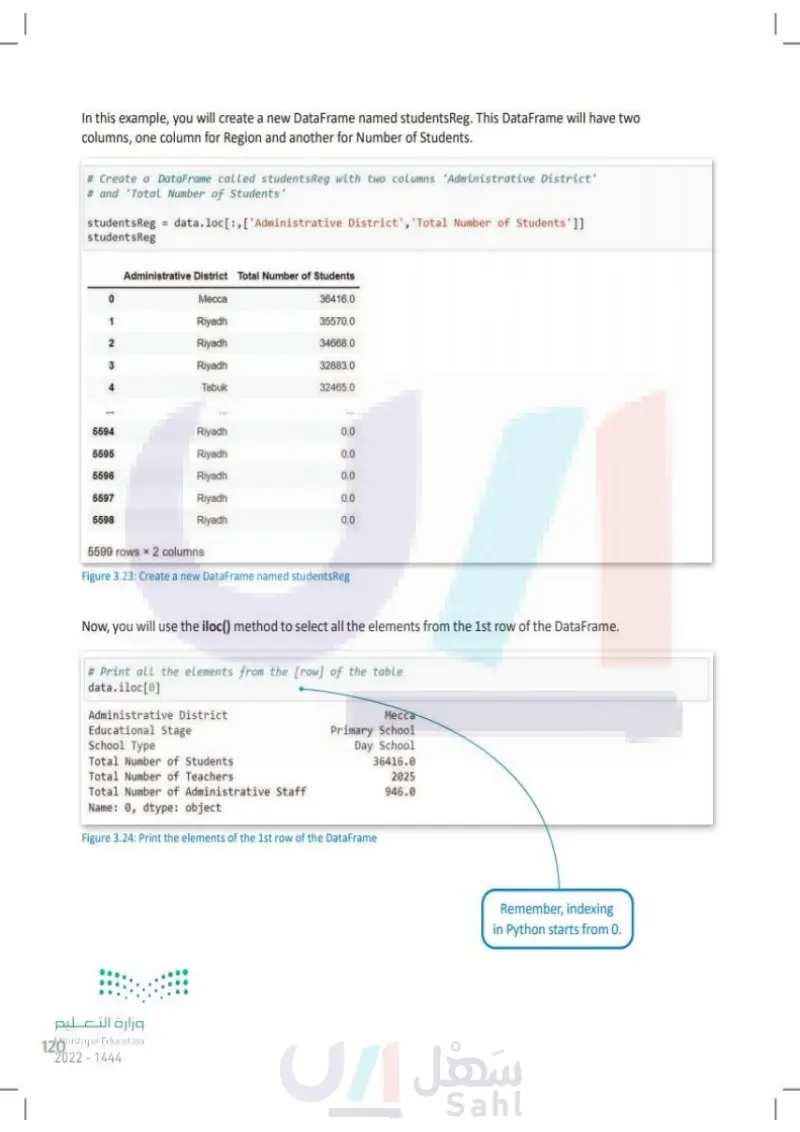
In this example, you will create a new DataFrame named students Reg. This DataFrame will have two columns, one column for Administrative District and another for Total Number of Students. # Create a DataFrame called studentsReg with two columns 'Administrative District' # and 'Total Number of Students' studentsReg = data.loc[:, ['Administrative District', 'Total Number of Students']] studentsReg Administrative District Total Number of Students 0 Месса 36416.0 1 Riyadh 35570.0 2 Riyadh 34668.0 3 Riyadh 32883.0 4 Tabuk 32465.0 5594 Riyadh 0.0 5595 Riyadh 0.0 5596 Riyadh 0.0 5597 Riyadh 0.0 5598 Riyadh 0.0 5599 rows * 2 columns Figure 3.23: Create a new Data Frame named students Reg Now, you will use the iloc() method to select all the elements from the 1st row of the DataFrame. # Print all the elements from the [row] of the table data.iloc[0] Administrative District Educational Stage School Type Total Number of Students Mecca Primary School Day School 36416.0 2025 946.0 Total Number of Teachers Total Number of Administrative Staff Name: 0, dtype: object Figure 3.24: Print the elements of the 1st row of the DataFrame وزارة التعليم Ministry of Education 120 2024-1446 Remember, indexing in Python starts from 0.

Now, you will use the iloc() method to select all the elements from the 1st row of the DataFrame
In this example, you will create a new DataFrame named studentsReg. This DataFrame will have two columns, one column for Region and another for Number of Students
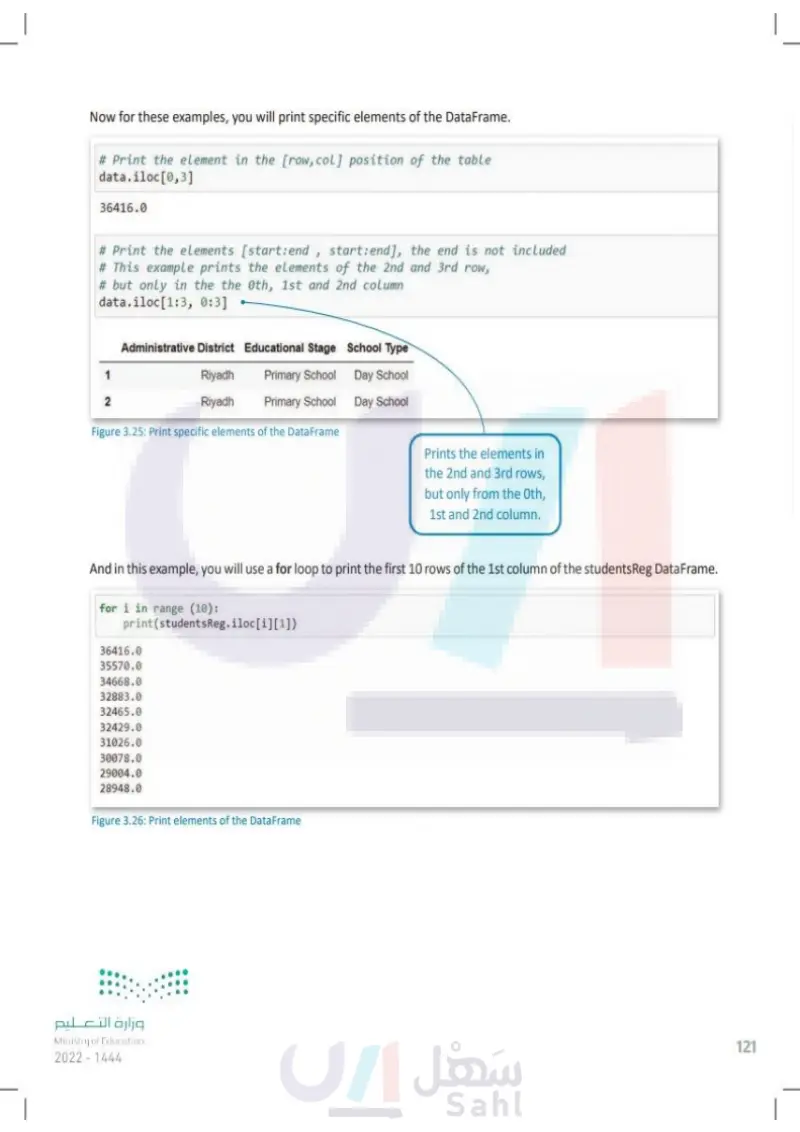
Now for these examples, you will print specific elements of the DataFrame. # Print the element in the [row, col] position of the table data.iloc[0,3] 36416.0 # Print the elements [start: end, start:end], the end is not included # This example prints the elements of the 2nd and 3rd row, # but only in the the 0th, 1st and 2nd column data.iloc[1:3, 0:3] Administrative District Educational Stage School Type 1 2 Riyadh Riyadh Primary School Primary School Day School Day School Figure 3.25: Print specific elements of the DataFrame Prints the elements in the 2nd and 3rd rows, but only from the Oth, 1st and 2nd column. And in this example, you will use a for loop to print the first 10 rows of the 1st column of the studentsReg Data Frame. for i in range (10): print(students Reg.iloc[i][1]) 36416.0 35570.0 34668.0 32883.0 32465.0 32429.0 31026.0 30078.0 29004.0 28948.0 Figure 3.26: Print elements of the DataFrame وزارة التعليم Ministry of Education 2024-1446 121

And in this example, you will use a for loop to print the first 10 rows of the 1st column of the studentsReg DataFrame
Now for these examples, you will print specific elements of the DataFrame
Grouping and Aggregating The process of putting a dataset's elements in groups based on some criteria and applying functions to these groups is called grouping. In Pandas library, this action is performed with the df.groupby() method. As an example, imagine you have a dataset with the top basketball scorers of all time. If you want to see how many players in this dataset played for a certain team, you can group this dataset by the "Team" column and perform the sum() function on the grouped data. Groupby Method Using the groupby() method you can split your data into different groups. This can help you to perform calculations for better data analysis. Table 3.10: Aggregate functions Function sum Meaning Aggregate function A function that makes mathematical calculations with the values of multiple rows which are grouped together, and as a result returns a single, summary value. The most common aggregate functions are sum, count, max, min and mean. Calculates the sum of a list of numbers. max Returns the maximum number of a list of numbers. min Returns the minimum number of a list of numbers. mean Calculates the average of a list of numbers. Let's see some examples of the groupby() method in the new DataFrame you have created. In this example, you group the students according to their region and you calculate the sum of the students in each region. # Create a DataFrame with two rows, one being 'Administrative District' # and the other one the 'Total Number of Students' in each region studentsReg.groupby('Administrative District').sum() Total Number of Students Administrative District Al Bahah 84464.0 Al Jowf Province 151527.0 This sum function is Al-Qassim 292996.0 one of the aggregate Aseer Province 480060.0 functions that the Pandas Eastern Province 909884.0 library supports. Hail 162609.0 Jazan 354608.0 Mecca 1421176.0 Medina 443254.0 Najran 145397.0 Northern Borders Province 88482.0 وزارة التعليم Ministry of Education 122 2024-1446 Riyadh Tabuk 1473222.0 205673.0 Figure 3.27: Use of the groupby() method to group the DataFrame by a single column

Aggregate functions
In this example, you group the students according to their region and you calculate the sum of the students in each region
Groupby Method
Grouping and Aggregating
Aggregate function
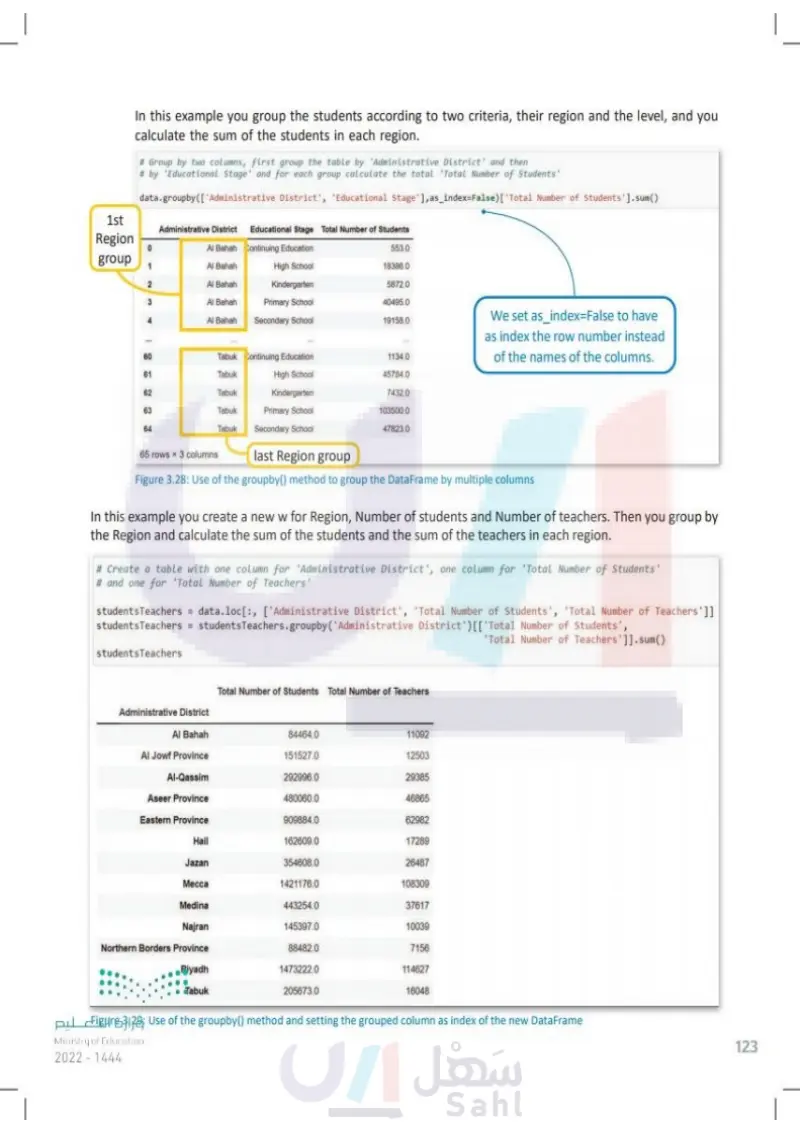
1st In this example you group the students according to two criteria, their region and the level, and you calculate the sum of the students in each region. # Group by two columns, first group the table by 'Administrative District' and then # by 'Educational Stage' and for each group calculate the total 'Total Number of Students' data.groupby(['Administrative District", "Educational Stage'], as_index=False) ["Total Number of Students'].sum() Administrative District Region 0 Al Bahah Continuing Education group Educational Stage Total Number of Students 553.0 123 Al Bahah High School 18386.0 Al Bahah Kindergarten 5872.0 Al Bahah Primary School 40495.0 Al Bahah Secondary School 19158.0 60 Tabuk Continuing Education 1134.0 61 Tabuk High School 45784.0 62 Tabuk Kindergarten 7432.0 63 Tabuk Primary School 64 Tabuk Secondary School 103500.0 47823.0 last Region group We set as_index=False to have as index the row number instead of the names of the columns. 65 rows * 3 columns Figure 3.28: Use of the groupby() method to group the Data Frame by multiple columns In this example you create a new for Administrative District, Total Number of Students and Total Number of Teachers. Then you group by the Administrative District and calculate the sum of the students and the sum of the teachers in each district. # Create a table with one column for 'Administrative District', one column for 'Total Number of Students' # and one for 'Total Number of Teachers' students Teachers = data.loc[:, ['Administrative District', 'Total Number of Students', 'Total Number of Teachers']] students Teachers = students Teachers.groupby('Administrative District')[["Total Number of Students', Total Number of Teachers']].sum() students Teachers Total Number of Students Total Number of Teachers Administrative District Al Bahah 84464.0 11092 Al Jowf Province 151527.0 12503 Al-Qassim 292996.0 29385 Aseer Province 480060.0 46865 Eastern Province 909884.0 62982 Hail 162609.0 17289 Jazan 354608.0 26487 Mecca 1421176.0 108309 Medina 443254.0 37617 Najran 145397.0 10039 Northern Borders Province 88482.0 7156 Riyadh Tabuk 1473222.0 114627 205673.0 16048 pulcïlläjljg Figure 3.29: Use of the groupby() method and setting the grouped column as index of the new DataFrame Ministry of Education 2024-1446 123

In this example you create a new w for Region, Number of students and Number of teachers. Then you group by the Region and calculate the sum of the students and the sum of the teachers in eac
In this example you group the students according to two criteria, their region and the level, and you calculate the sum of the students in each region
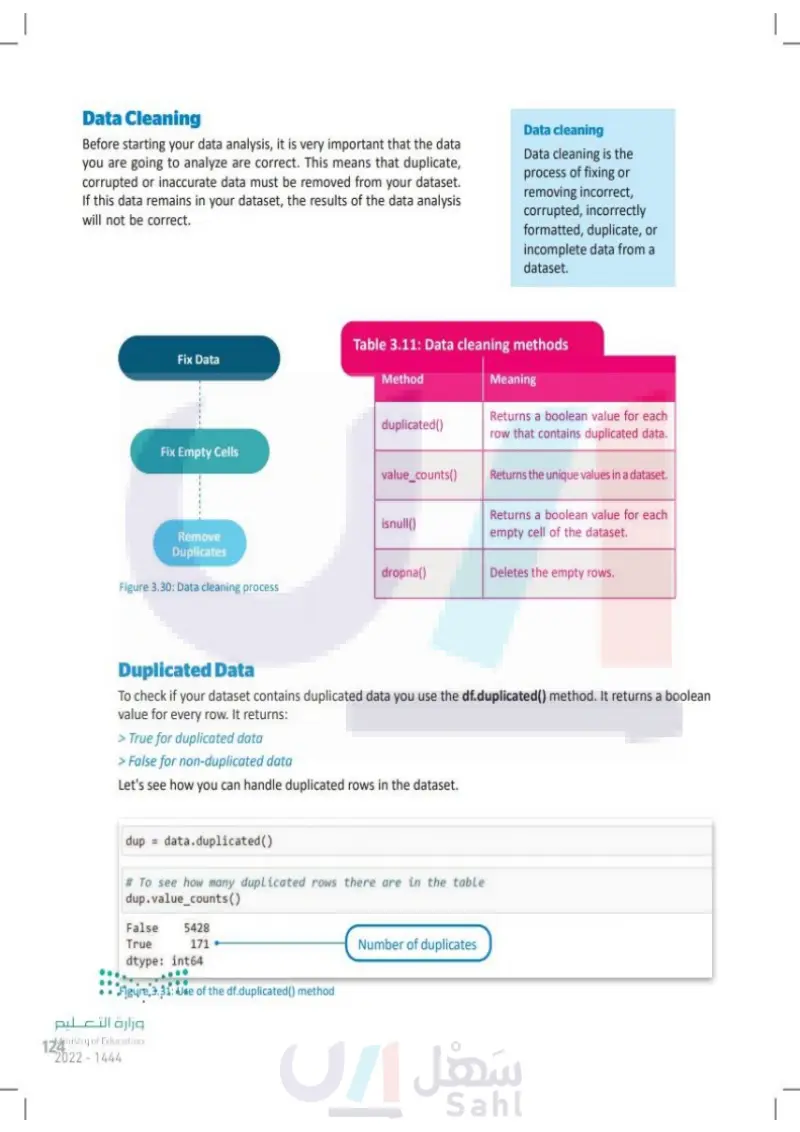
Data Cleaning Before starting your data analysis, it is very important that the data you are going to analyze are correct. This means that duplicate, corrupted or inaccurate data must be removed from your dataset. If this data remains in your dataset, the results of the data analysis will not be correct. Data cleaning Data cleaning is the process of fixing or removing incorrect, corrupted, incorrectly formatted, duplicate, or incomplete data from a dataset. Fix Data Table 3.11: Data cleaning methods Method Meaning duplicated() Returns a boolean value for each row that contains duplicated data. Fix Empty Cells value_counts() Returns the unique values in a dataset. isnull() Remove Duplicates Returns a boolean value for each empty cell of the dataset. dropna() Deletes the empty rows. Figure 3.30: Data cleaning process Duplicated Data To check if your dataset contains duplicated data you use the df.duplicated() method. It returns a boolean value for every row. It returns: > True for duplicated data > False for non-duplicated data Let's see how you can handle duplicated rows in the dataset. dup data.duplicated() # To see how many duplicated rows there are in the table dup.value_counts() False True 5428 171 dtype: int64 وزارة التعليم Ministry of Education 124 2024-1446 Number of duplicates Figure 3.31: Use of the df.duplicated() method

Use of the df.duplicated() method
Duplicated Data
Figure 3.30: Data cleaning process
Data cleaning methods
Data Cleaning
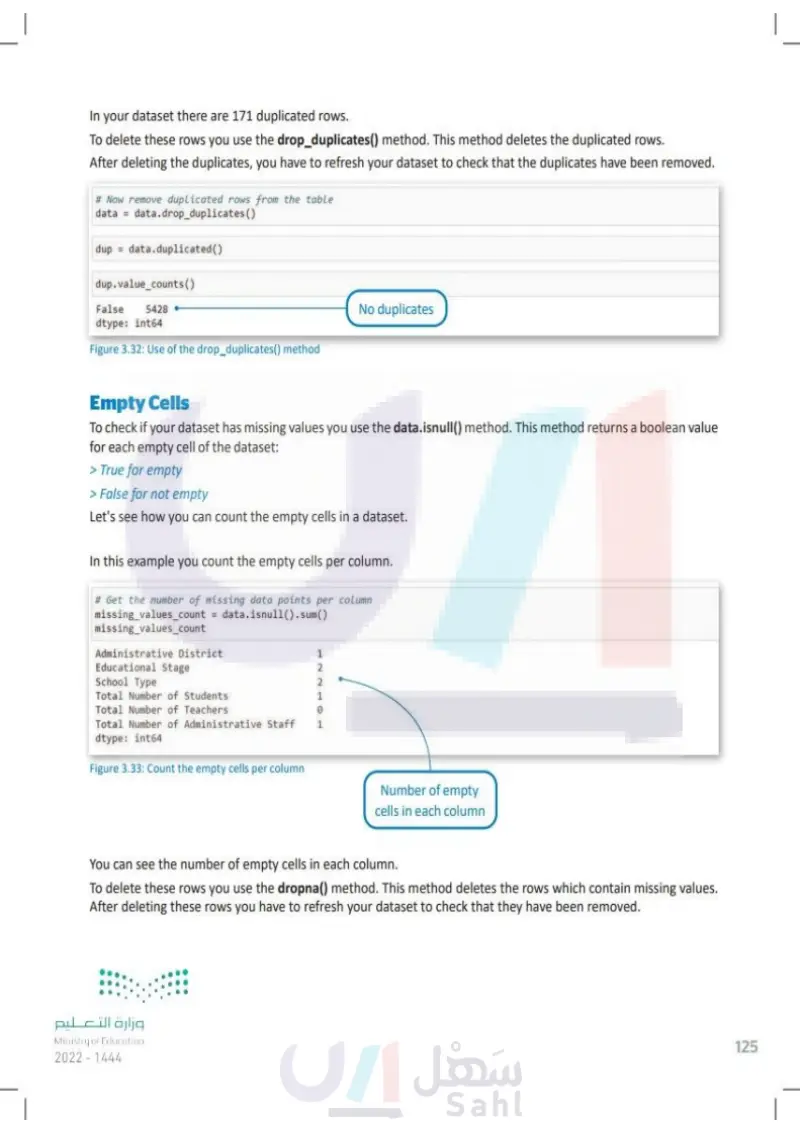
In your dataset there are 171 duplicated rows. To delete these rows you use the drop_duplicates() method. This method deletes the duplicated rows. After deleting the duplicates, you have to refresh your dataset to check that the duplicates have been removed. # Now remove duplicated rows from the table data = data.drop_duplicates() dup data.duplicated() dup.value_counts() 5428 False dtype: int64 No duplicates Figure 3.32: Use of the drop_duplicates() method Empty Cells To check if your dataset has missing values you use the data.isnull() method. This method returns a boolean value for each empty cell of the dataset: > True for empty > False for not empty Let's see how you can count the empty cells in a dataset. In this example you count the empty cells per column. # Get the number of missing data points per column missing_values_count = data.isnull().sum() missing_values_count Administrative District 1 2 222OL Educational Stage School Type Total Number of Students 1 Total Number of Teachers 0 Total Number of Administrative Staff dtype: int64 1 Figure 3.33: Count the empty cells per column Number of empty cells in each column You can see the number of empty cells in each column. To delete these rows you use the dropna() method. This method deletes the rows which contain missing values. After deleting these rows you have to refresh your dataset to check that they have been removed. وزارة التعليم Ministry of Education 2024-1446 125

After deleting the duplicates, you have to refresh your dataset to check that the duplicates have been removed
Empty Cells
In this example you count the empty cells per column
You can see the number of empty cells in each column
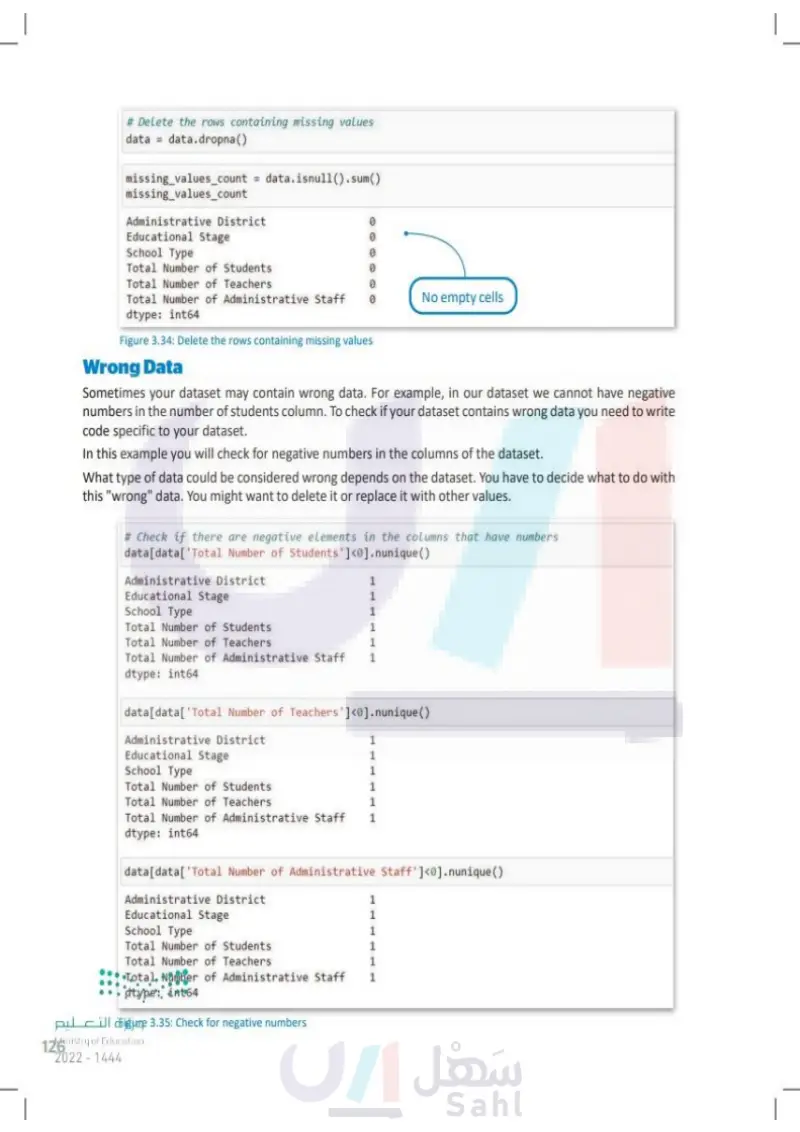
# Delete the rows containing missing values data data.dropna () missing_values_count = data.isnull().sum() missing_values_count Administrative District Educational Stage School Type 0 0 Total Number of Students 0 Total Number of Teachers 0 Total Number of Administrative Staff dtype: int64 0 No empty cells Figure 3.34: Delete the rows containing missing values Wrong Data Sometimes your dataset may contain wrong data. For example, in our dataset we cannot have negative numbers in the number of students column. To check if your dataset contains wrong data you need to write code specific to your dataset. In this example you will check for negative numbers in the columns of the dataset. What type of data could be considered wrong depends on the dataset. You have to decide what to do with this "wrong" data. You might want to delete it or replace it with other values. # Check if there are negative elements in the columns that have numbers data[data['Total Number of Students' ]<0].nunique() Administrative District Educational Stage School Type 1 1 1 Total Number of Students 1 Total Number of Teachers 1 Total Number of Administrative Staff 1 dtype: int64 data[data['Total Number of Teachers']<0].nunique() Administrative District 1 Educational Stage School Type 1 1 Total Number of Students 1 Total Number of Teachers 1 Total Number of Administrative Staff 1 dtype: int64 data[data['Total Number of Administrative Staff']<0].nunique() Administrative District Educational Stage School Type Total Number of Students Total Number of Teachers Total Number of Administrative Staff dtype: int64 1 1 1 1 1 1 وزارة التعليم Ministry of Education 126 2024-1446 Figure 3.35: Check for negative numbers

Check for negative numbers
Wrong Data
Delete the rows containing missing values
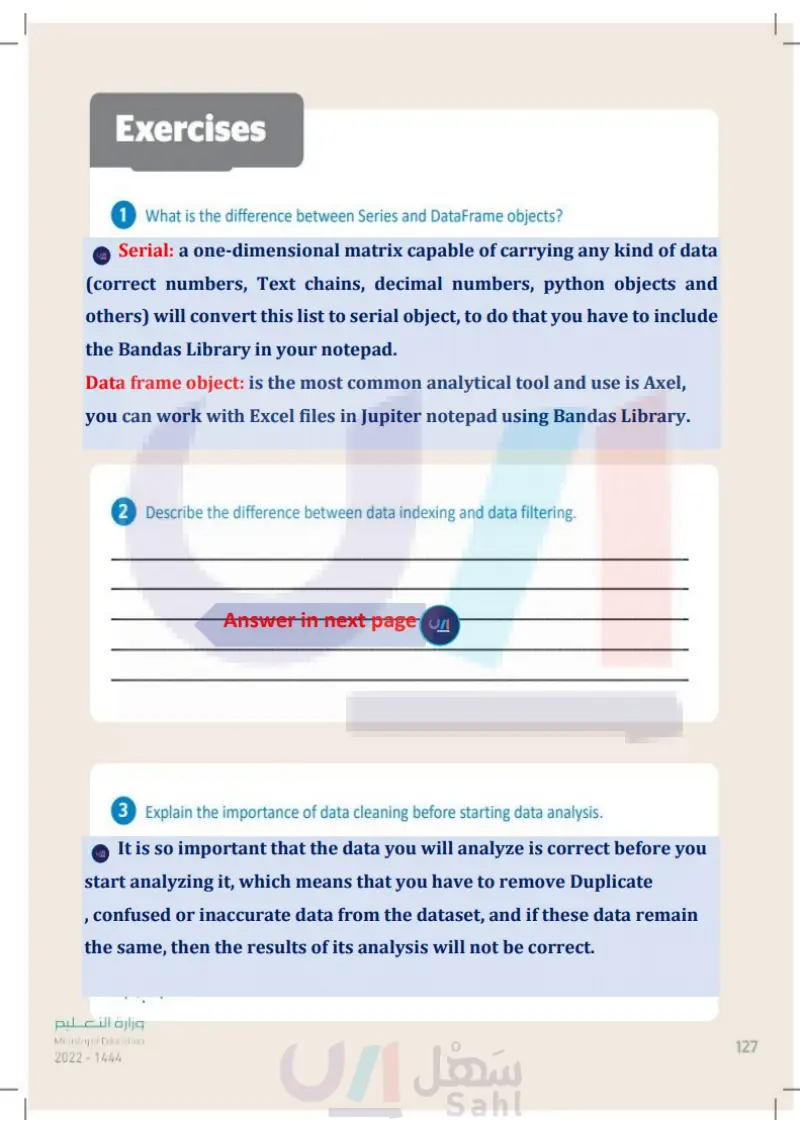
Exercises 1 What is the difference between Series and Data Frame objects? 2 Describe the difference between data indexing and data filtering. 3 Explain the importance of data cleaning before starting data analysis. وزارة التعليم Ministry of Education 2024-1446 127

Explain the importance of data cleaning before starting data analysis

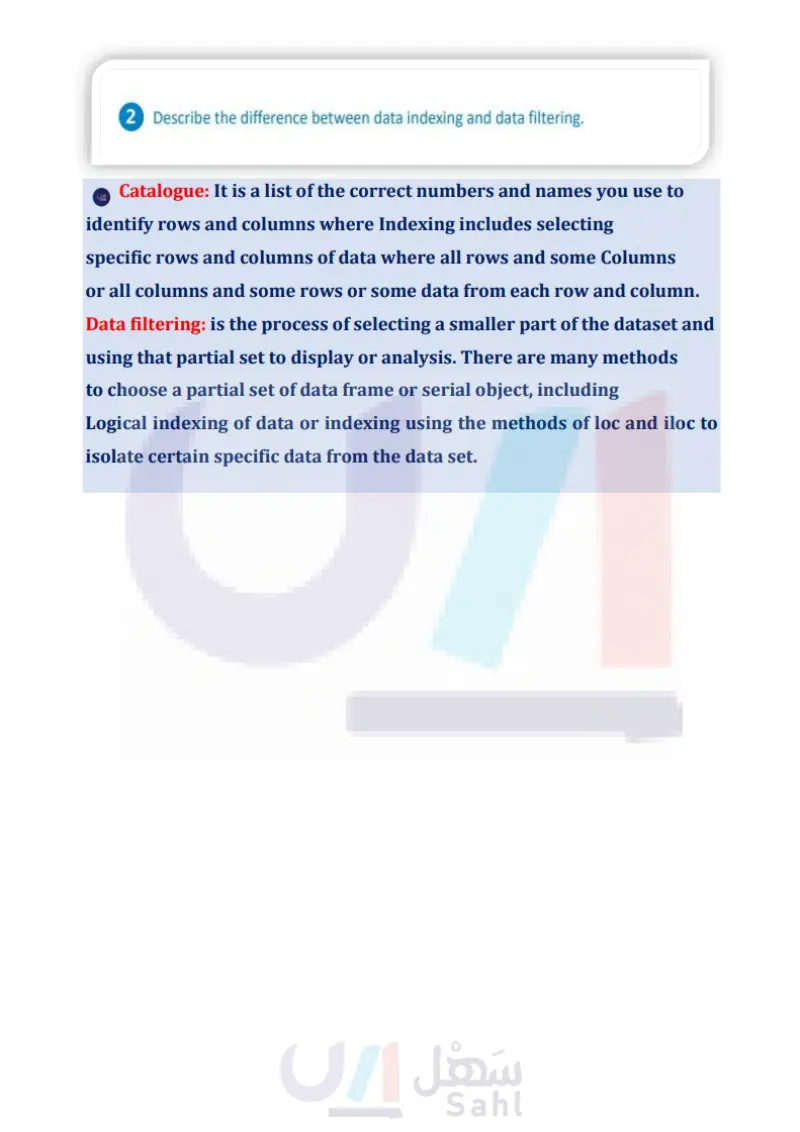
Describe the difference between data indexing and data filtering
What is the difference between Series and DataFrame objects?
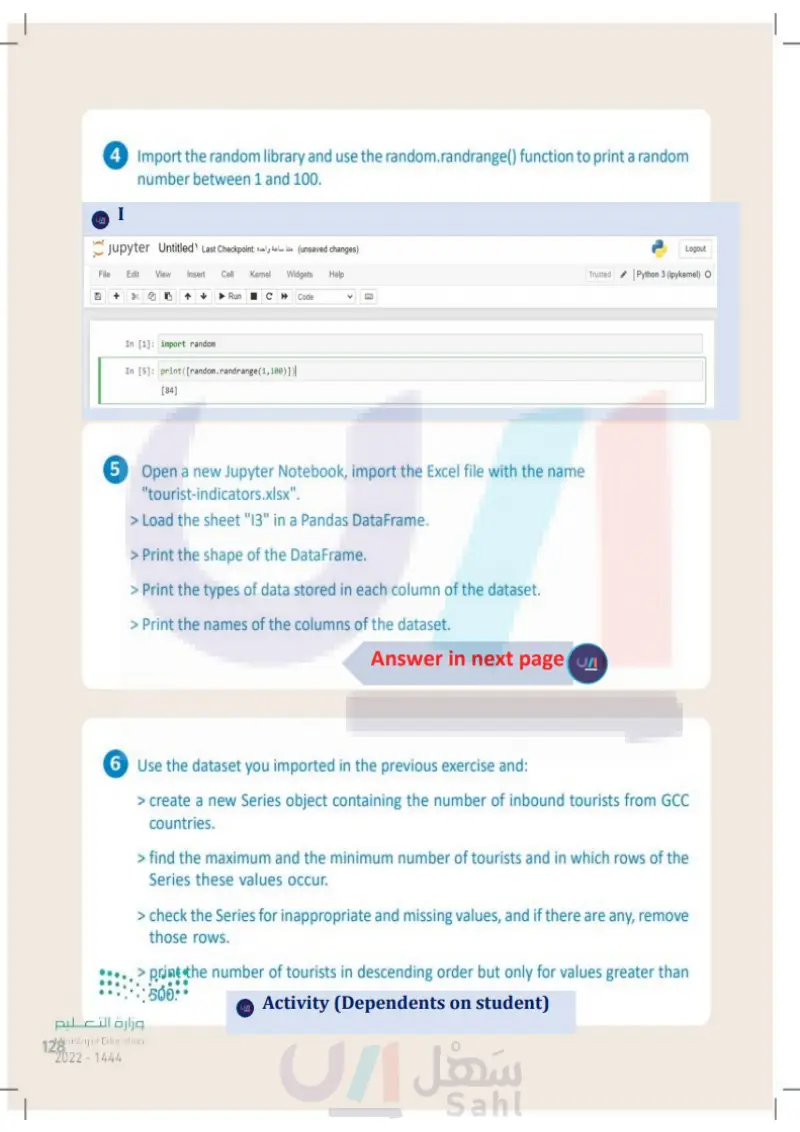
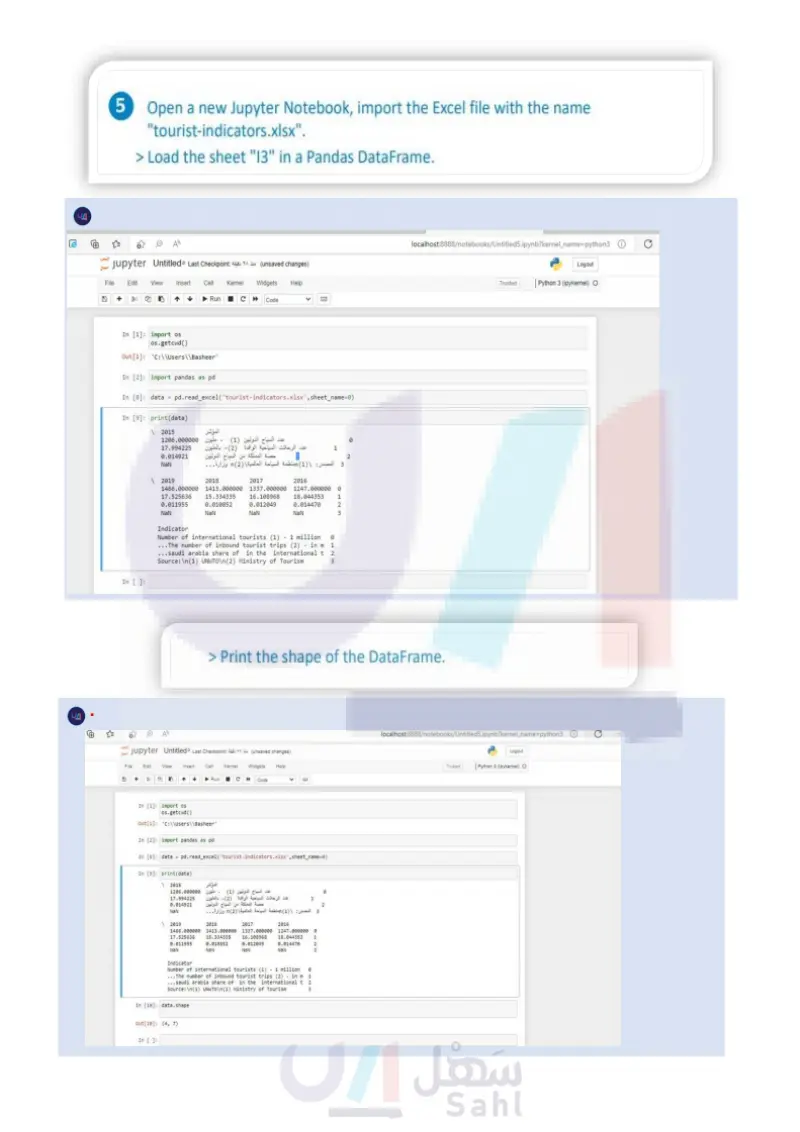
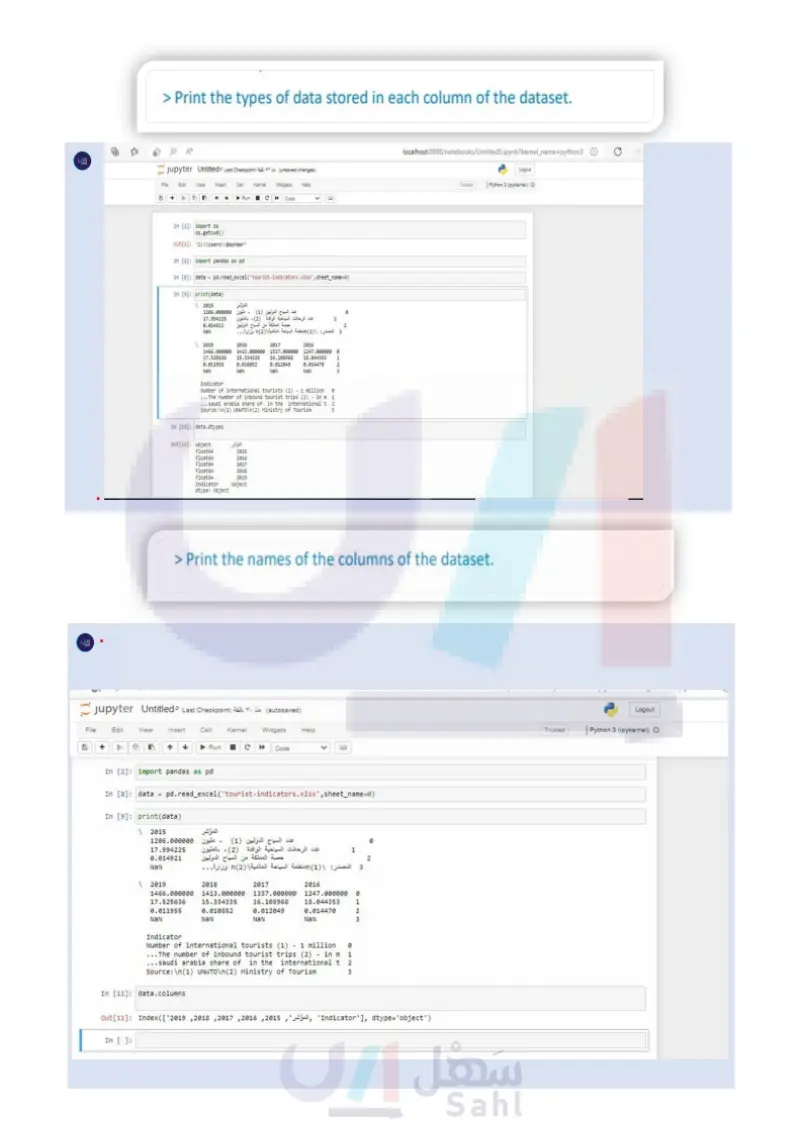
4 Import the random library and use the random.randrange() function to print a random number between 1 and 100. LO 5 Open a new Jupyter Notebook, import the Excel file with the name "tourist-indicators.xlsx". > Load the sheet "13" in a Pandas DataFrame. > Print the shape of the DataFrame. > Print the types of data stored in each column of the dataset. > Print the names of the columns of the dataset. 6 Use the dataset you imported in the previous exercise and: > create a new Series object containing the number of inbound tourists from GCC countries. > find the maximum and the minimum number of tourists and in which rows of the Series these values occur. > check the Series for inappropriate and missing values, and if there are any, remove those rows. > print the number of tourists in descending order but only for values greater than 500. وزارة التعليم Ministry of Education 128 2024-1446

Use the dataset you imported in the previous exercise and
Open a new Jupyter Notebook, import the Excel file with the name "tourist-indicators.xlsx"
Import the random library and use the random.randrange() function to print a random number between 1 and 100
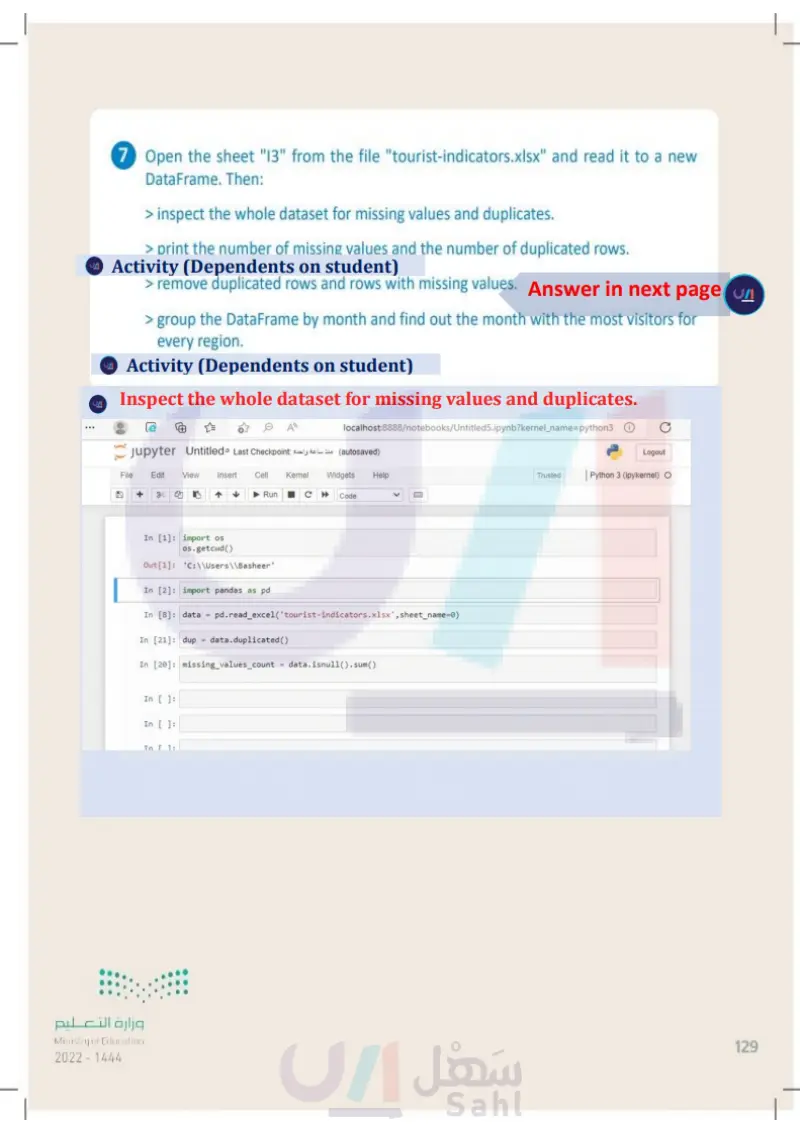
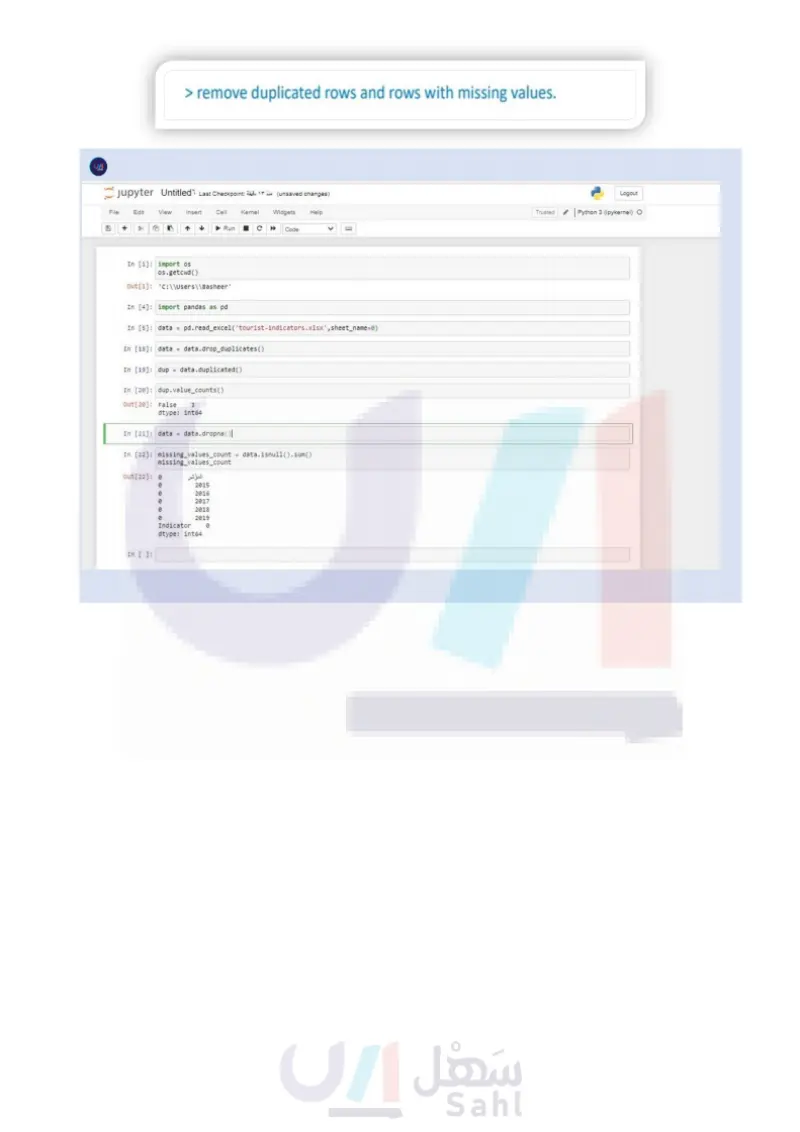
7 Open the sheet "13" from the file "tourist-indicators.xlsx" and read it to a new DataFrame. Then: > inspect the whole dataset for missing values and duplicates. > print the number of missing values and the number of duplicated rows. > remove duplicated rows and rows with missing values. > group the DataFrame by month and find the month with the most visitors for every region. وزارة التعليم Ministry of Education 2024-1446 129

Open the sheet "I3" from the file "tourist-indicators.xlsx" and read it to a new DataFrame. Then