Data Analysis - Data Science - ثاني ثانوي
1. Introduction to Data Science
3. Exploratory Data Analysis
4. Predictive data modeling and forecasting
3. Exploratory Data Analysis In the previous units, you learned what data is, the different types of data and how to properly collect data. In this unit, you will learn about how to explore and analyze the data you have in order to better understand the data. Learning Objectives In this unit, you will learn to: > Categorize the types of data analysis. > Define what exploratory data analysis is. > Categorize the types of exploratory data analysis. > List the stages of the exploratory data analysis process. > Define what a programming library is. > Develop a data analysis program using programming libraries. > Use data preparation and cleaning techniques in a dataset. > Discuss the importance of data visualization. > Generate different types of charts using Python libraries. وزارة التعليم Ministry of Education 94 2024-1446 O

Exploratory Data Analysis
Learning Objectives Categorize the types of data analysis
Tools: Jupyter Notebook
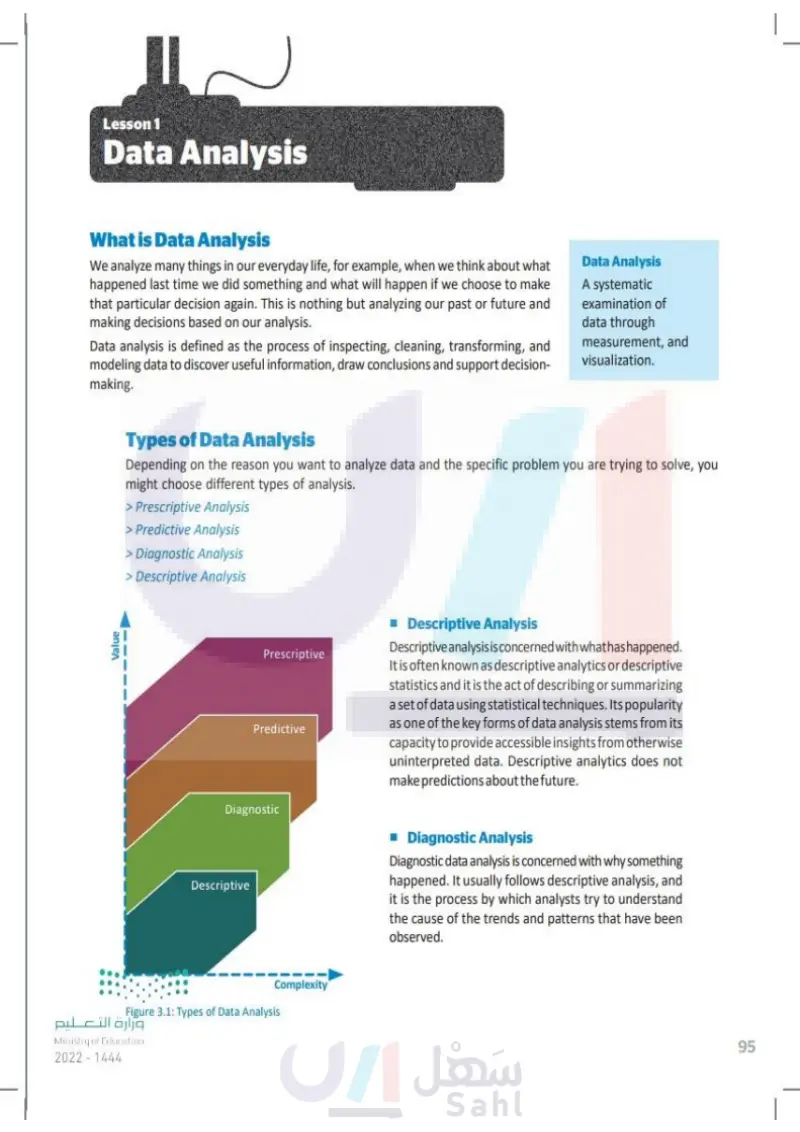
Lesson 1 Data Analysis Link to digital lesson www.ien.edu.sa Concept of Data Analysis We analyze many things in our everyday life, for example, when we think about what happened last time we did something and what will happen if we choose to make that particular decision again. This is nothing but analyzing our past or future and making decisions based on our analysis. Data analysis is defined as the process of inspecting, cleaning, transforming, and modeling data to discover useful information, draw conclusions and support decision- making. Data Analysis A systematic examination of data through measurement and visualization. Value Types of Data Analysis Depending on the reason you want to analyze data and the specific problem you are trying to solve, you might choose different types of analysis. > Prescriptive Analysis > Predictive Analysis > Diagnostic Analysis > Descriptive Analysis Prescriptive Predictive ■ Descriptive Analysis Descriptive analysis is concerned with what has happened. It is often known as descriptive analytics or descriptive statistics and it is the act of describing or summarizing a set of data using statistical techniques. Its popularity as one of the key forms of data analysis stems from its capacity to provide accessible insights from otherwise uninterpreted data. Descriptive analytics does not make predictions about the future. Diagnostic Descriptive Complexity Eigure 3.1: Types of Data Analysis زارة التعليم Ministry of Education 2024-1446 ■ Diagnostic Analysis Diagnostic data analysis is concerned with why something happened. It usually follows descriptive analysis, and it is the process by which analysts try to understand the cause of the trends and patterns that have been observed. 95

Diagnostic Analysis
Descriptive Analysis
Types of Data Analysis
Types of Data Analysis
What is Data Analysis
Data Analysis
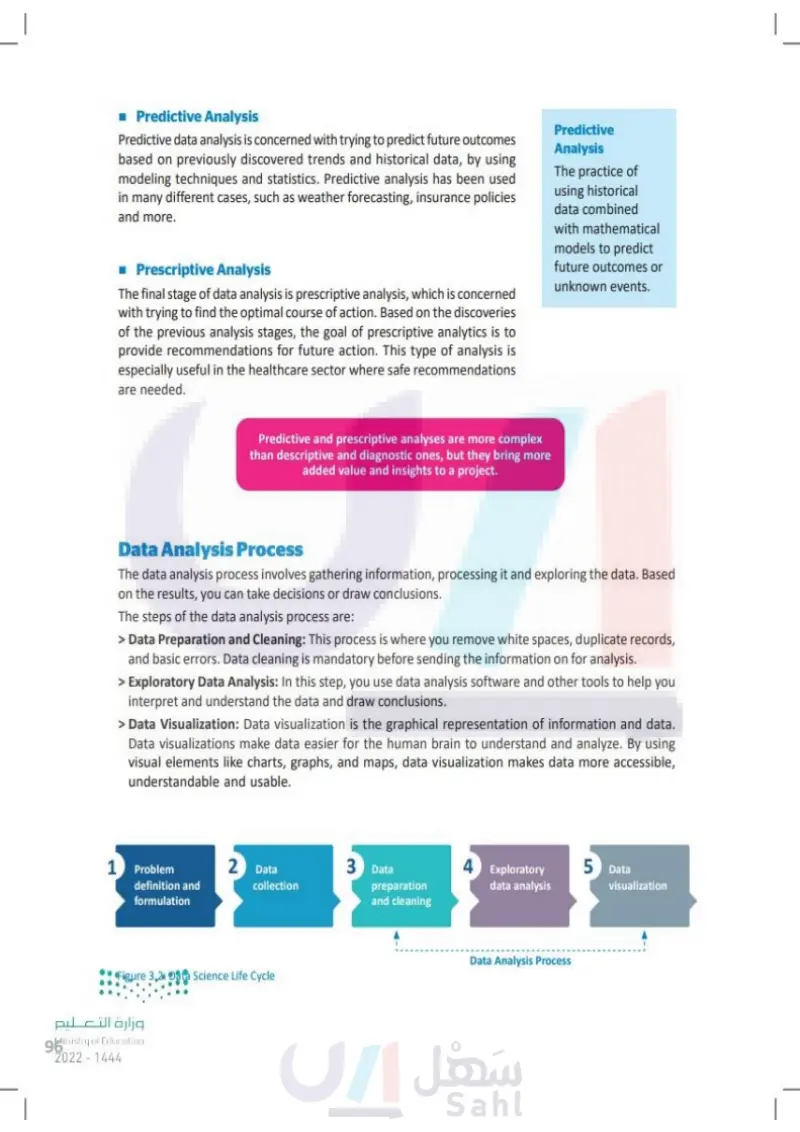
■ Predictive Analysis Predictive data analysis is concerned with trying to predict future outcomes based on previously discovered trends and historical data, by using modeling techniques and statistics. Predictive analysis has been used in many different cases, such as weather forecasting, insurance policies and more. ■ Prescriptive Analysis The final stage of data analysis is prescriptive analysis, which is concerned with trying to find the optimal course of action. Based on the discoveries of the previous analysis stages, the goal of prescriptive analysis is to provide recommendations for future action. This type of analysis is especially useful in the healthcare sector where safe recommendations are needed. Predictive Analysis The practice of using historical data combined with mathematical models to predict future outcomes or unknown events. Predictive and prescriptive analyses are more complex than descriptive and diagnostic ones, but they bring more added value and insights to a project. The Data Analysis Process The data analysis process involves gathering information, processing it and exploring the data. Based on the results, you can take decisions or draw conclusions. The steps of the data analysis process are: > Data Preparation and Cleaning: This process is where you remove white spaces, duplicate records, and basic errors. Data cleaning is mandatory before sending the information on for analysis. > Exploratory Data Analysis: In this step, you use data analysis software and other tools to help you interpret and understand the data and draw conclusions. > Data Visualization: Data visualization is the graphical representation of information and data. Data visualizations make data easier for the human brain to understand and analyze. By using visual elements like charts, graphs, and maps, data visualization makes data more accessible, understandable and usable. 1 Problem definition and formulation 2 Data collection 3 Data 4 preparation and cleaning Exploratory data analysis 5 Data visualization Figure 3.2: Data Science Life Cycle وزارة التعليم Ministry of Education 96 2024-1446 Data Analysis Process

Data Science Life Cycle
Data Analysis Process
Predictive and prescriptive analyses are more complex than descriptive and diagnostic ones, but they bring more added value and insights to a project.
Prescriptive Analysis
Predictive Analysis
Predictive Analysis
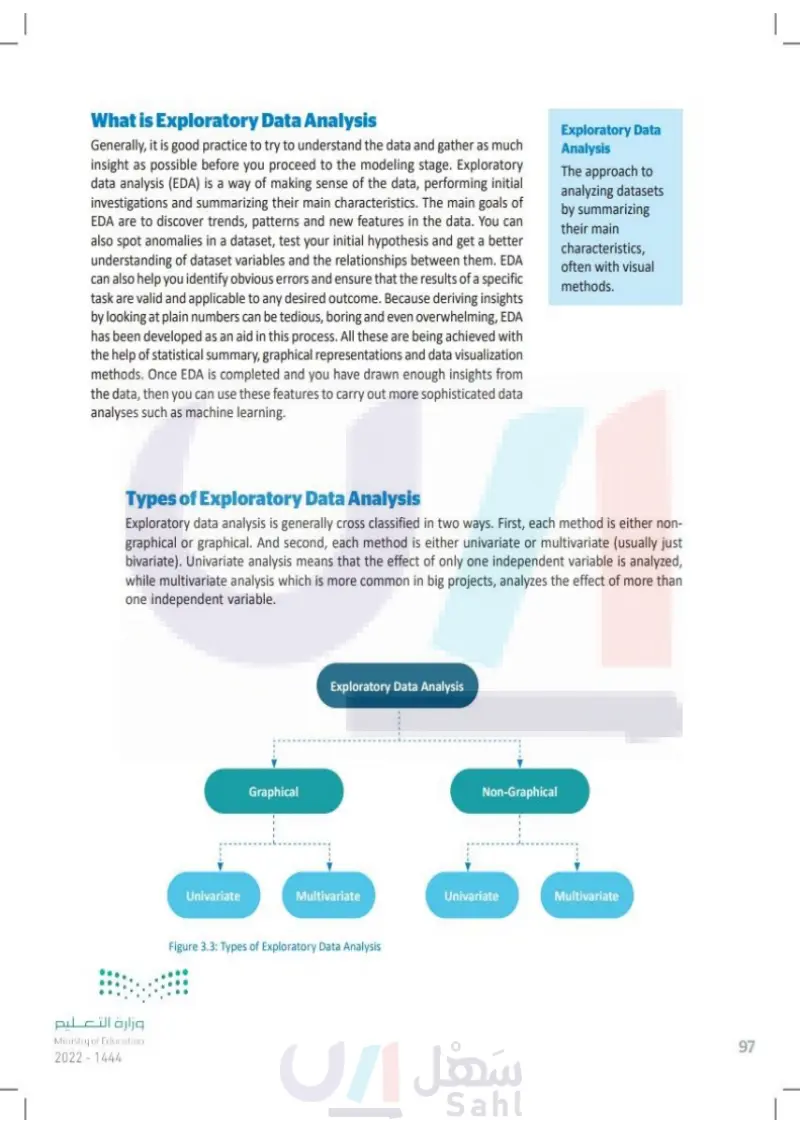
What is Exploratory Data Analysis Generally, it is good practice to try to understand the data and gather as much insight as possible before you proceed to the modeling stage. Exploratory data analysis (EDA) is a way of making sense of the data, performing initial investigations and summarizing their main characteristics. The main goals of EDA are to discover trends, patterns and new features in the data. You can also spot anomalies in a dataset, test your initial hypothesis and get a better understanding of dataset variables and the relationships between them. EDA can also help you identify obvious errors and ensure that the results of a specific task are valid and applicable to any desired outcome. Because deriving insights by looking at plain numbers can be tedious, boring and even overwhelming, EDA has been developed as an aid in this process. All these are being achieved with the help of statistical summaries, graphical representations and data visualization methods. Once EDA is completed and you have drawn enough insights from the data, then you can use these features to carry out more sophisticated data analyses such as machine learning. Exploratory Data Analysis The approach to analyzing datasets by summarizing their main characteristics, often with visual methods. Types of Exploratory Data Analysis Exploratory data analysis is generally cross classified in two ways. First, each method is either non- graphical or graphical. And second, each method is either univariate or multivariate (usually just bivariate). Univariate analysis means that the effect of only one independent variable is analyzed, while multivariate analysis, which is more common in big projects, analyzes the effect of more than one independent variable. وزارة التعليم Ministry of Education 2024-1446 Graphical Exploratory Data Analysis Univariate Multivariate Non-Graphical Univariate Multivariate Figure 3.3: Types of Exploratory Data Analysis 97

Types of Exploratory Data Analysis
Types of Exploratory Data Analysis
What is Exploratory Data Analysis
Exploratory Data Analysis
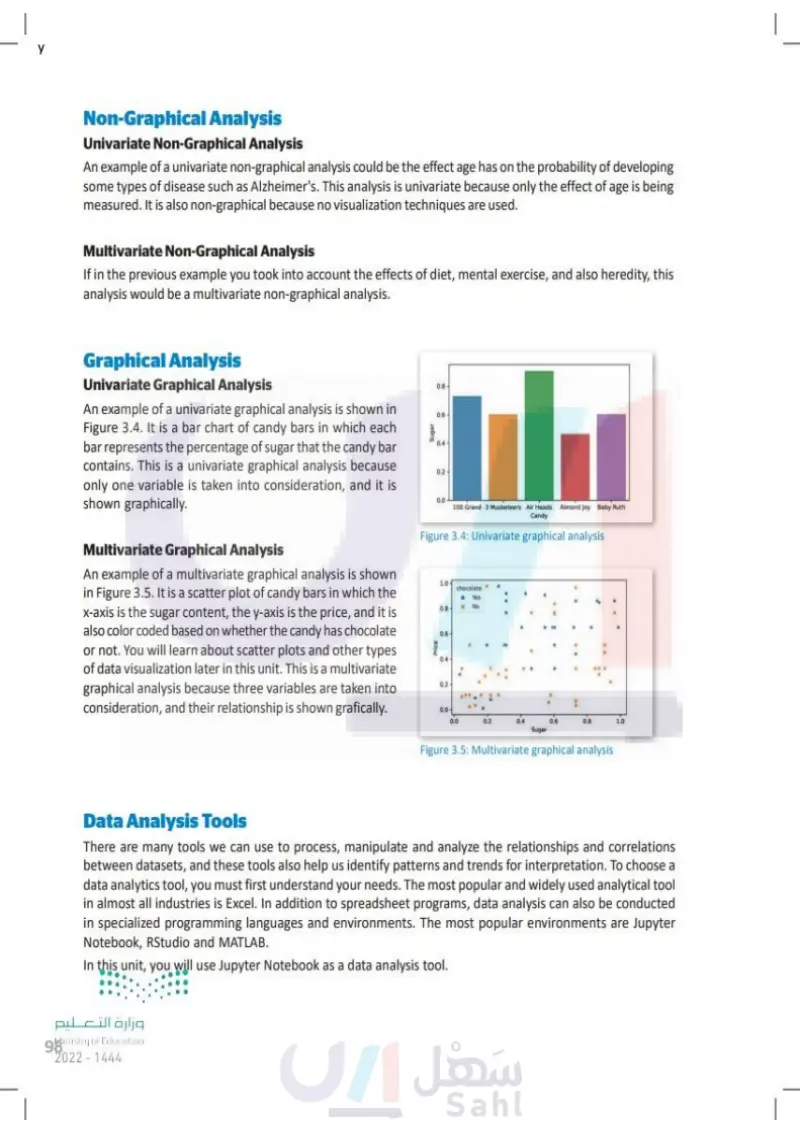
Non-Graphical Analysis Univariate Non-Graphical Analysis An example of a univariate non-graphical analysis could be the effect age has on the probability of developing some types of disease, such as Alzheimer's. This analysis is univariate because only the effect of age is being measured. It is also non-graphical because no visualization techniques are used. Multivariate Non-Graphical Analysis If in the previous example you took into account the effects of diet, mental exercise, and also heredity, this analysis would be a multivariate non-graphical analysis. 0.0 100 Grand 3 Musketeers Air Heads Almond Joy Baby Ruth Candy Figure 3.4: Univariate graphical analysis Graphical Analysis Univariate Graphical Analysis An example of a univariate graphical analysis is shown in Figure 3.4. It is a bar chart of candy bars in which each bar represents the percentage of sugar that the candy bar contains. This is a univariate graphical analysis because only one variable is taken into consideration, and it is shown graphically. Multivariate Graphical Analysis An example of a multivariate graphical analysis is shown in Figure 3.5. It is a scatter plot of candy bars in which the x-axis is the sugar content, the y-axis is the price, and it is also color coded based on whether the candy has chocolate or not. You will learn about scatter plots and other types of data visualization later in this unit. This is a multivariate graphical analysis because three variables are taken into consideration, and their relationship is shown graphically.. Sugar Price 0.8 0.6 0.4 0.2- 1.0- chocolate Yes No 0.8 0.6- 0.44 0.2- 0.0- 0.0 0.2 0.4 0.6 0.8 1.0 Sugar Figure 3.5: Multivariate graphical analysis Data Analysis Tools There are many tools we can use to process, manipulate and analyze the relationships and correlations. between datasets, and these tools also help us identify patterns and trends for interpretation. To choose a data analytics tool, you must first understand your needs. The most popular and widely used analytical tool in almost all industries is Excel. In addition to spreadsheet programs, data analysis can also be conducted in specialized programming languages and environments. The most popular environments are Jupyter Notebook, RStudio and MATLAB. In this unit, you will use Jupyter Notebook as a data analysis tool. وزارة التعليم Ministry of Education 98 2024-1446

Data Analysis Tools
Figure 3.5: Multivariate graphical analysis
Figure 3.4: Univariate graphical analysis
Graphical Analysis
Non-Graphical Analysis
Multivariate Non-Graphical Analysis
Multivariate Graphical Analysis
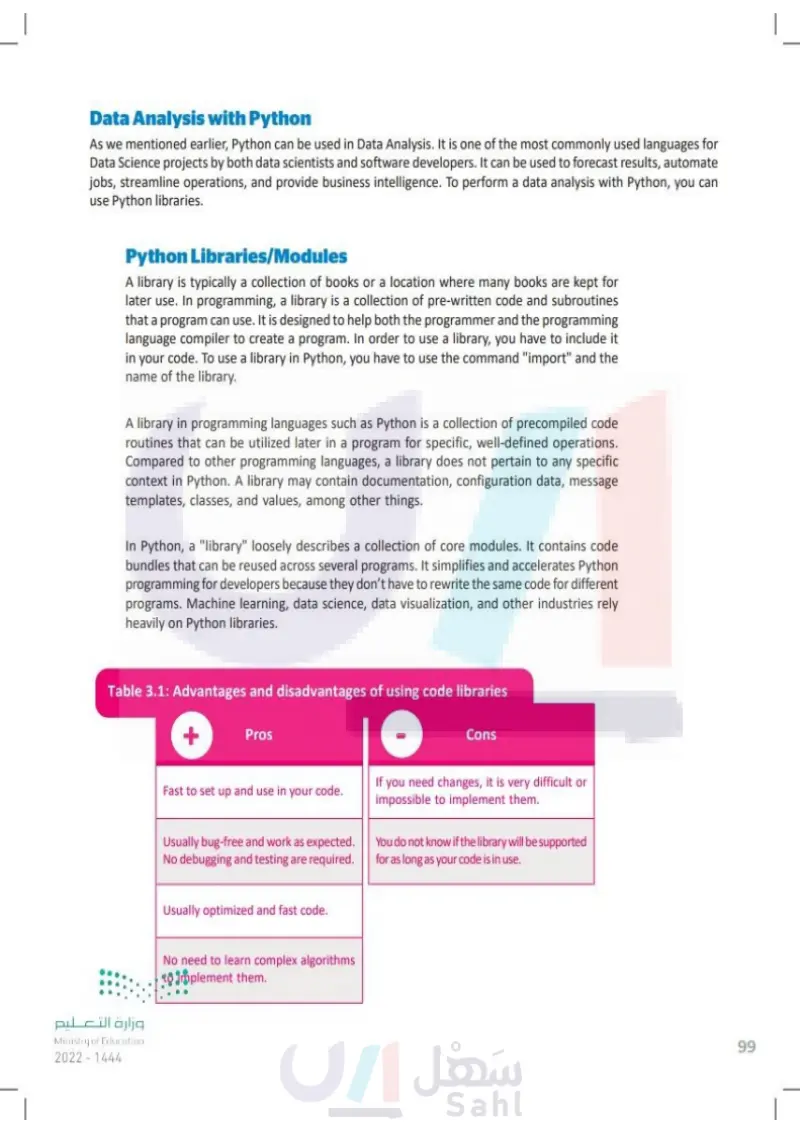
Data Analysis with Python As we mentioned earlier, Python can be used in Data Analysis. It is one of the most commonly used languages for Data Science projects by both data scientists and software developers. It can be used to forecast results, automate jobs, streamline operations, and provide business intelligence. To perform data analysis with Python, you can use Python libraries. Python Libraries/Modules A library is typically a collection of books or a location where many books are kept for later use. In programming, a library is a collection of pre-written code and subroutines that a program can use. It is designed to help both the programmer and the programming language compiler to create a program. In order to use a library, you have to include it in your code. To use a library in Python, you have to use the command "import" and the name of the library. A library in programming languages such as Python is a collection of precompiled code routines that can be utilized later in a program for specific, well-defined operations. Compared to other programming languages, a library does not pertain to any specific context in Python. A library may contain documentation, configuration data, message templates, classes, and values, among other things. In Python, a "library" loosely describes a collection of core modules. It contains code bundles that can be reused across several programs. It simplifies and accelerates Python programming for developers because they don't have to rewrite the same code for different programs. Machine learning, data science, data visualization, and other industries rely heavily on Python libraries. Table 3.1: Advantages and disadvantages of using code libraries وزارة التعليم Ministry of Education 2024-1446 Pros Cons Fast to set up and use in your code. Usually bug-free and work as expected. No debugging and testing are required. If you need changes, it is very difficult or impossible to implement them. You do not know if the library will be supported for as long as your code is in use. Usually optimized and fast code. No need to learn complex algorithms . to implement them. 99

Table 3.1: Advantages and disadvantages of using code libraries
Python Libraries/Modules
Data Analysis with Python
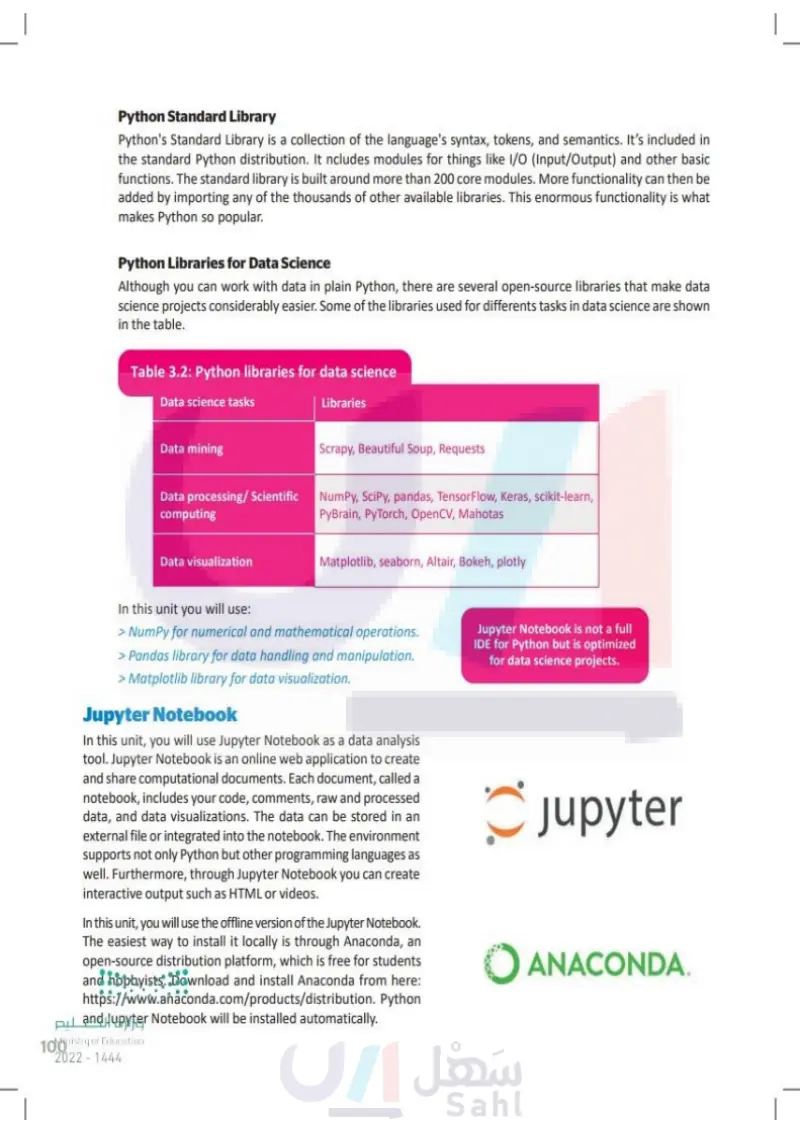
Python Standard Library Python's Standard Library is a collection of the language's syntax, tokens, and semantics. It's included in the standard Python distribution. It includes modules for things like I/O (Input/Output) and other basic functions. The standard library is built around more than 200 core modules. More functionality can then be added by importing any of the thousands of other available libraries. This enormous functionality is what makes Python so popular. Python Libraries for Data Science Although you can work with data in plain Python, there are several open-source libraries that make data science projects considerably easier. Some of the libraries used for differents tasks in data science are shown in the table. Table 3.2: Python libraries for data science Data science tasks Libraries Data mining Scrapy, Beautiful Soup, Requests Data processing / Scientific computing NumPy, SciPy, pandas, TensorFlow, Keras, scikit-learn, PyBrain, PyTorch, OpenCV, Mahotas Data visualization Matplotlib, seaborn, Altair, Bokeh, plotly In this unit you will use: > NumPy for numerical and mathematical operations. > Pandas library for data handling and manipulation. > Matplotlib library for data visualization. Jupyter Notebook In this unit, you will use Jupyter Notebook as a data analysis tool. Jupyter Notebook is an online web application for creating and sharing computational documents. Each document, called a notebook, includes your code, comments, raw and processed data, and data visualizations. The data can be stored in an external file or integrated into the notebook. The environment supports not only Python but other programming languages as well. Furthermore, through Jupyter Notebook you can create interactive output such as HTML or videos. In this unit, you will use the offline version of the Jupyter Notebook. The easiest way to install it locally is through Anaconda, an open-source distribution platform, which is free for students and hobbyists. Download and install Anaconda from here: https://www.anaconda.com/products/distribution. Python and Jupyter Notebook will be installed automatically. Ministry of Education 100 2024-1446 Jupyter Notebook is not a full IDE for Python but is optimized for data science projects. ご Jupyter → ANACONDA.

Jupyter Notebook
In this unit you will use:
Table 3.2: Python libraries for data science
Python Libraries for Data Science
Python Standard Library
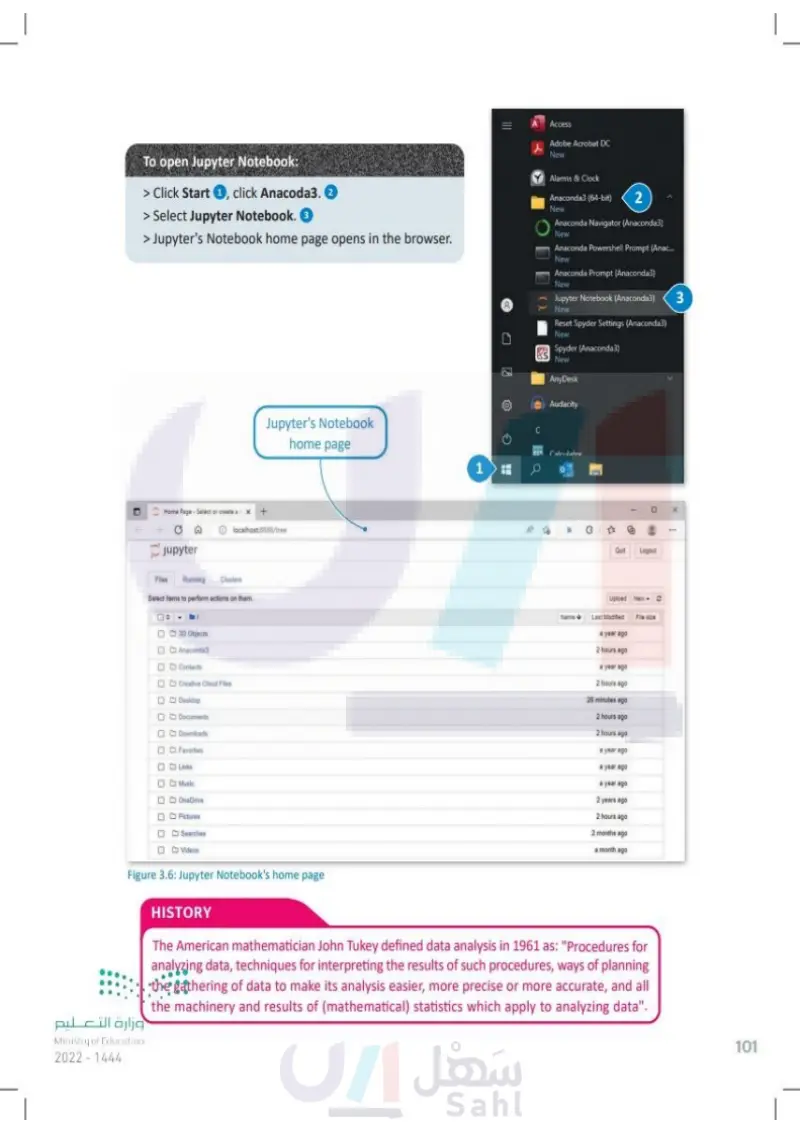
Access Adobe Acrobat DC New Alarms & Clock Anaconda3 (64-bit) 2 New Anaconda Navigator (Anaconda3) Anaconda Powershell Prompt (Anac... New To open Jupyter Notebook: > Click Start 1, click Anacoda3. ② > Select Jupyter Notebook. 3 > Jupyter's Notebook home page opens in the browser. New D Jupyter's Notebook Home Page-Select or create a * + CA home page localhost:8888/tree Jupyter Files Running Clusters Select items to perform actions on them. 0 0 3D Objects Anaconda3 Contacts Creative Cloud Files Desktop Documents Downloads Favorites Links Music OneDrive Pictures Searches Videos 0 0 0 0 0 Anaconda Prompt (Anaconda3) New Jupyter Notebook (Anaconda3) New 3 Reset Spyder Settings (Anaconda3) New Spyder (Anaconda3) New AnyDesk Audacity Calculator 1 Figure 3.6: Jupyter Notebook's home page O Quit Logout Name↓ Upload New Last Modified File size a year ago 2 hours ago a year ago 2 hours ago 26 minutes ago 2 hours ago 2 hours ago a year ago a year ago a year ago 2 years ago 2 hours ago 2 months ago a month ago X HISTORY The American mathematician John Tukey defined data analysis in 1961 as: "Procedures for analyzing data, techniques for interpreting the results of such procedures, ways of planning the gathering of data to make its analysis easier, more precise or more accurate, and all the machinery and results of (mathematical) statistics which apply to analyzing data". رارة التعليم Ministry of Education 2024-1446 101

HISTORY The American mathematician John Tukey defined data analysis in 1961
To open Jupyter Notebook
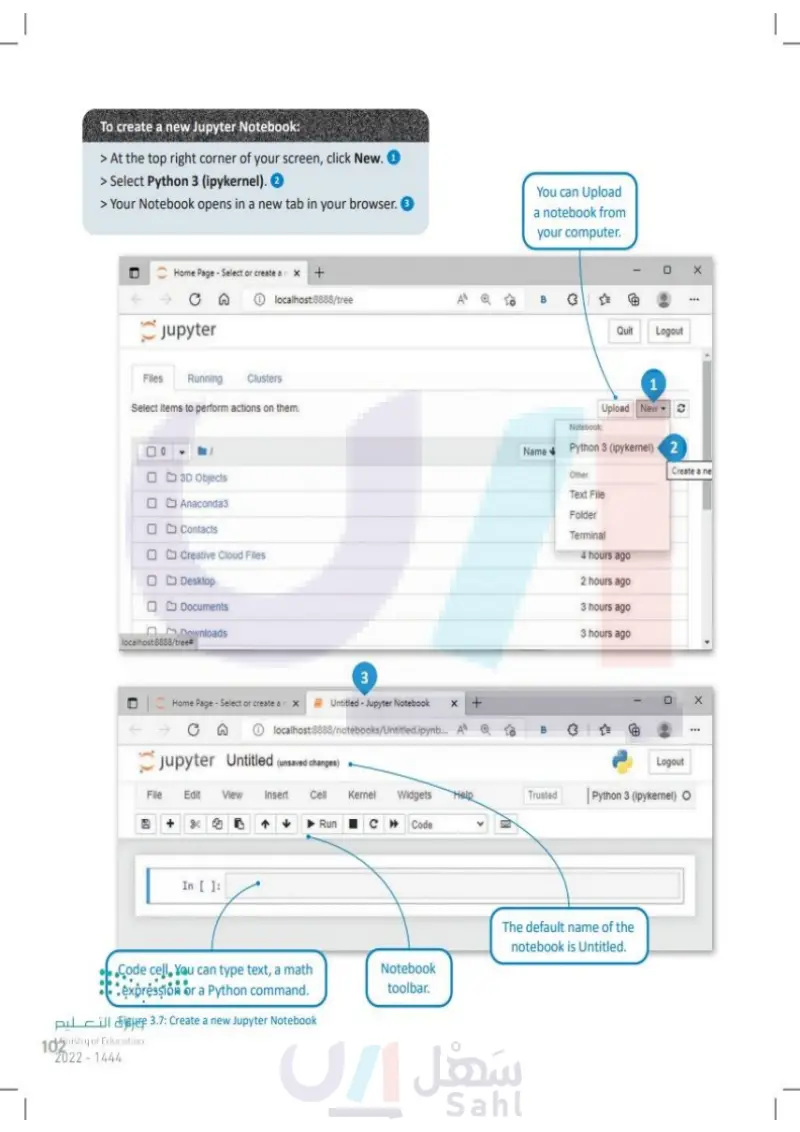
To create a new Jupyter Notebook: > At the top right corner of your screen, click New. ① > Select Python 3 (ipykernel). 2 > Your Notebook opens in a new tab in your browser. 3 You can Upload a notebook from your computer. Home Page - Select or create a x + CA Jupyter Files Running localhost:8888/tree Clusters Select items to perform actions on them. □ 0 ㅁㅁ 3D Objects Anaconda3 Contacts Creative Cloud Files Desktop Documents Downloads localhost:8888/tree= 3 Home Page - Select or create a X Untitled - Jupyter Notebook A B Quit Logout 1 Upload New C Notebook: Name Python 3 (ipykernel) 2 + B Other: Text File Folder Terminal 4 hours ago 2 hours ago 3 hours ago 3 hours ago х Create a ne - X localhost:8888/notebooks/Untitled.ipynb... A Jupyter Untitled (unsaved changes) Logout File Edit View Insert Cell 1+ Kernel Widgets Help Run C▸ Code Trusted | Python 3 (ipykernel) O In [ ] : The default name of the notebook is Untitled. Code cell, You can type text, a math expression or a Python command. وزارة التعليم Notebook toolbar. Figure 3.7: Create a new Jupyter Notebook Ministry of Education 102 2024-1446

To create a new Jupyter Notebook
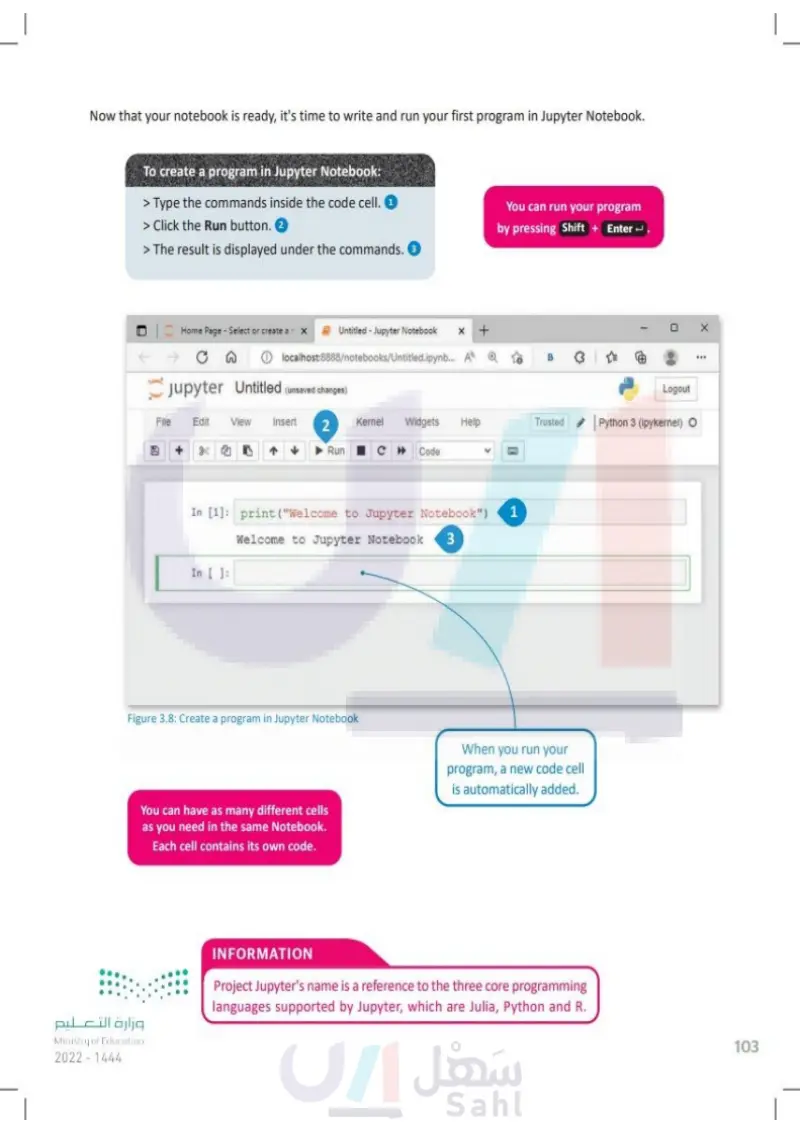
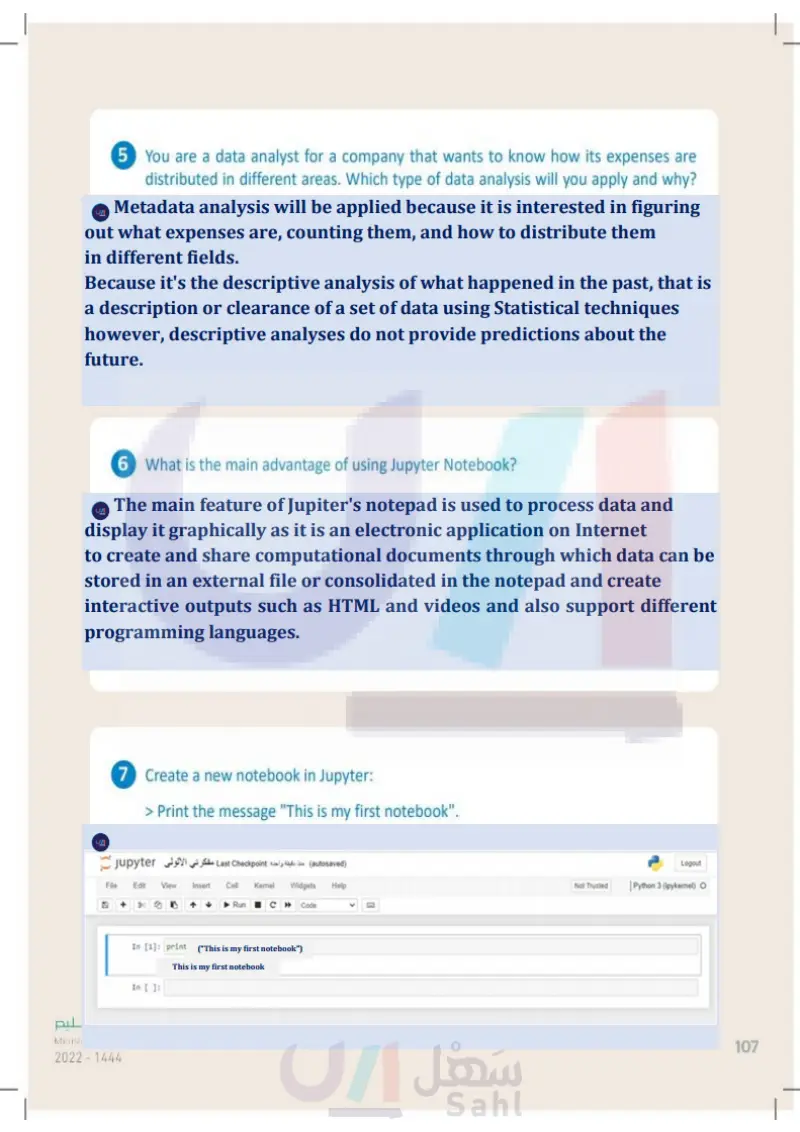
Now that your notebook is ready, it's time to write and run your first program in Jupyter Notebook. To create a program in Jupyter Notebook: > Type the commands inside the code cell. ① > Click the Run button. 2 > The result is displayed under the commands. You can run your program by pressing Shift + Enter + Home Page - Select or create an X x + B Untitled - Jupyter Notebook localhost:8888/notebooks/Untitled.ipynb... A Jupyter Untitled (unsaved changes) Logout File Edit View Insert 2 Kernel Widgets Help Trusted Python 3 (ipykernel) O B 20 + Run C Code In [1]: print ("Welcome to Jupyter Notebook") 1 Welcome to Jupyter Notebook 3 In [ ] : Figure 3.8: Create a program in Jupyter Notebook You can have as many different cells as you need in the same notebook. Each cell contains its own code. When you run your program, a new code cell is automatically added. وزارة التعليم Ministry of Education 2024-1446 INFORMATION Project Jupyter's name is a reference to the three core programming languages supported by Jupyter, which are Julia, Python and R. 103

Project Jupyter's name is a reference to the three core programming languages supported by Jupyter
You can have as many different cells as you need in the same Notebook. Each cell contains its own code.
Figure 3.8: Create a program in Jupyter Notebook
To create a program in Jupyter Notebook:
You can run your program by pressing Shift + Enter
Now that your notebook is ready, it's time to write and run your first program in Jupyter Notebook.
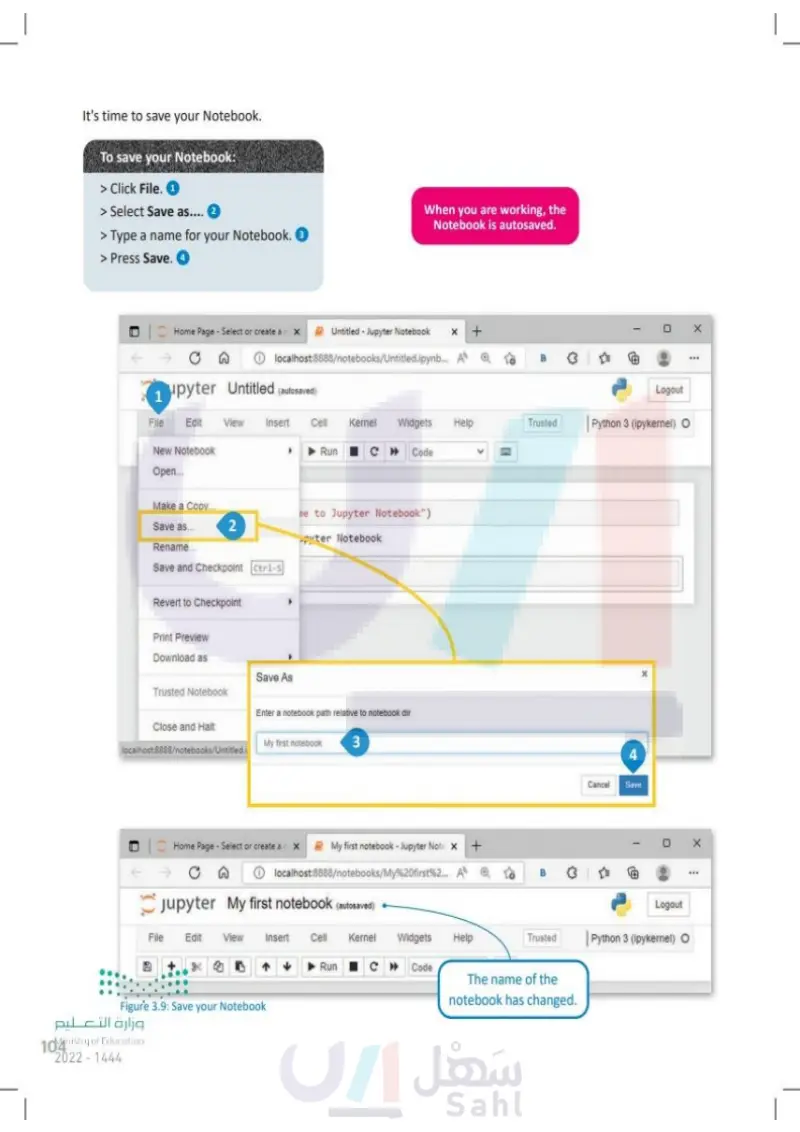
It's time to save your notebook. To save your notebook: > Click File. ①1 > Select Save as.... 2 > Type a name for your notebook. 3 > Press Save. 4 When you are working, the notebook is autosaved. Home Page - Select or create a x Untitled - Jupyter Notebook ①localhost:8888/notebooks/Untitled.ipynb... A + B 1 upyter Untitled (autosaved) File Edit View Insert Cell Kernel Widgets Help Trusted New Notebook Run C Code Open... Make a Copy... Save as... se to Jupyter Notebook") 2 ter Notebook Rename... Save and Checkpoint Ctrl-s Revert to Checkpoint Print Preview Download as Save As Trusted Notebook Enter a notebook path relative to notebook dir Close and Halt localhost:8888/notebooks/Untitled.i My first notebook 3 My first notebook - Jupyter Note X + ①localhost:8888/notebooks/My%20first%2... A Home Page - Select or create a X A Jupyter My first notebook (autosaved) File Edit View Insert Cell Kernel Widgets Help 2017 Run CCode Figure 3.9: Save your notebook وزارة التعليم Ministry of Education 104 2024-1446 B Logout Python 3 (ipykernel) O 4 Cancel Save X Logout Trusted Python 3 (ipykernel) O The name of the notebook has changed. X

Save your Notebook
When you are working, the Notebook is autosaved.
It's time to save your Notebook.
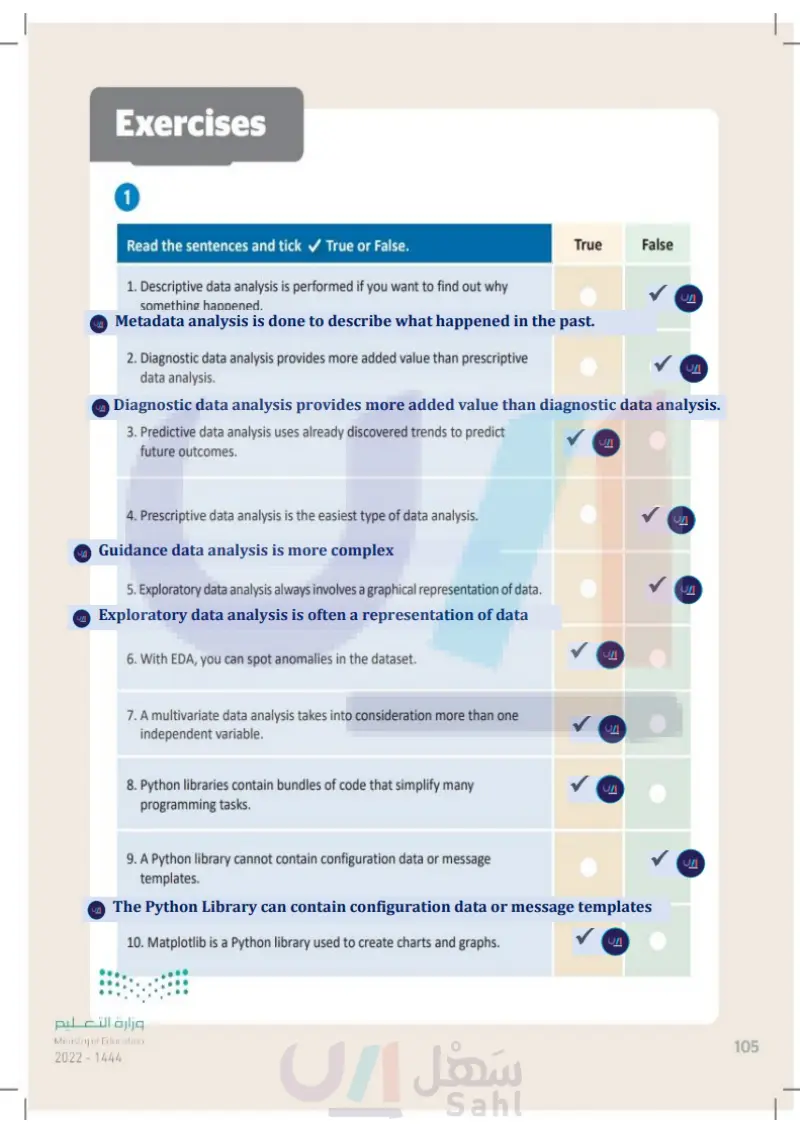
Exercises 1 Read the sentences and tick ✓ True or False. 1. Descriptive data analysis is performed if you want to find out why something happened. 2. Diagnostic data analysis provides more added value than prescriptive data analysis. 3. Predictive data analysis uses already discovered trends to predict future outcomes. 4. Prescriptive data analysis is the easiest type of data analysis. 5. Exploratory data analysis always involves a graphical representation of data. 6. With EDA, you can spot anomalies in the dataset. 7. A multivariate data analysis takes into consideration more than one independent variable. 8. Python libraries contain bundles of code that simplify many programming tasks. 9. A Python library cannot contain configuration data or message templates. 10. Matplotlib is a Python library used to create charts and graphs. وزارة التعليم Ministry of Education 2024-1446 True False 105

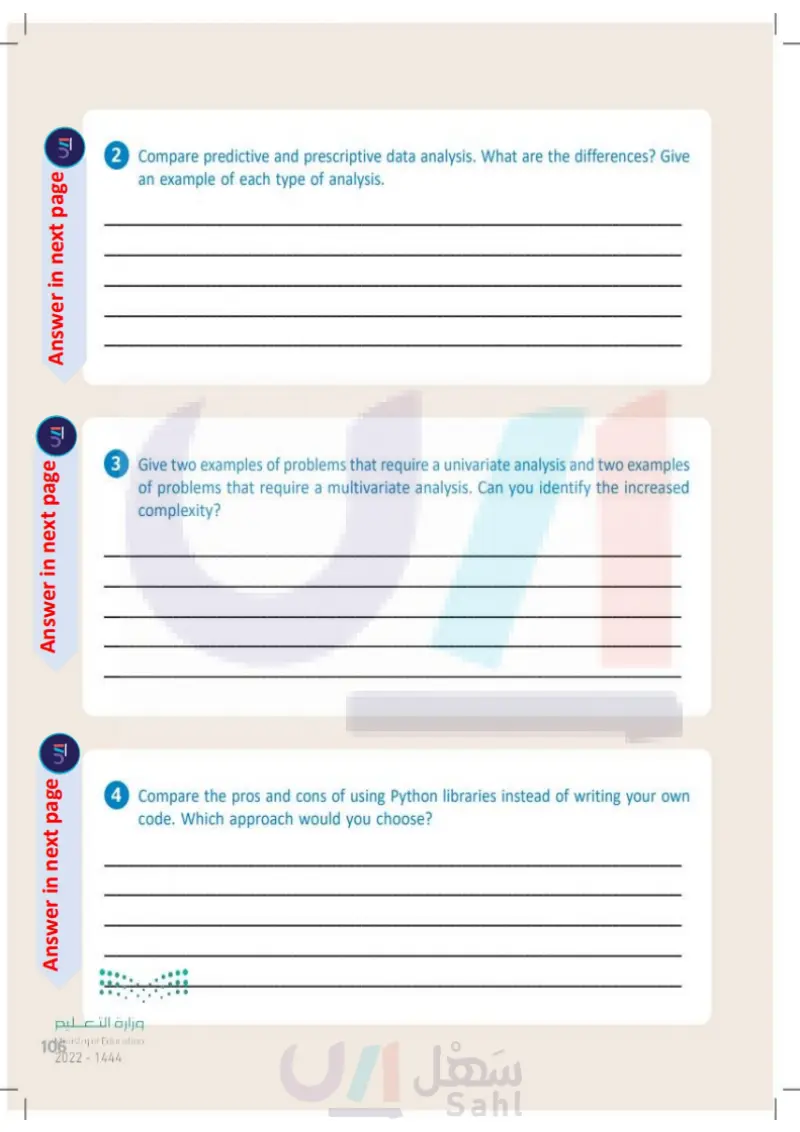
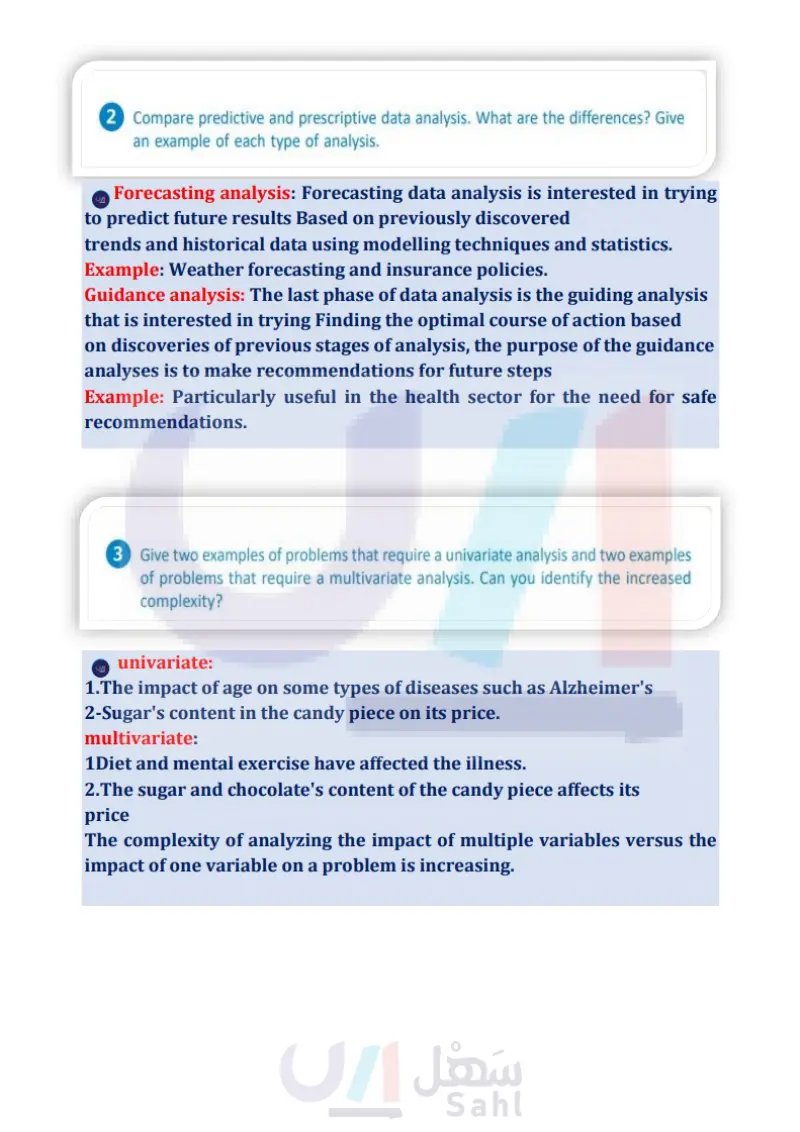
2 Compare predictive and prescriptive data analysis. What are the differences? Give an example of each type of analysis. 3 Give two examples of problems that require a univariate analysis and two examples of problems that require a multivariate analysis. Can you identify the increased complexity? 4 Compare the pros and cons of using Python libraries instead of writing your own code. Which approach would you choose? وزارة التعليم Ministry of Education 106 2024-1446

Compare the pros and cons of using Python libraries instead of writing your own code. Which approach would you choose?

5 You are a data analyst for a company that wants to know how its expenses are distributed in different areas. Which type of data analysis will you apply and why? 6 What is the main advantage of using Jupyter Notebook? 7 Create a new notebook in Jupyter: > Print the message "This is my first notebook". > Save the notebook with a name of your choice. وزارة التعليم Ministry of Education 2024 -1446 107


