Predictive Data Modeling - Data Science - ثاني ثانوي
1. Introduction to Data Science
3. Exploratory Data Analysis
4. Predictive data modeling and forecasting
4. Predictive data modeling and forecasting In this unit, students will obtain basic knowledge about predictive data modeling and forecasting. More specifically, students will learn what predictive modeling is and what are the different types of predictive models and their applications. Additionally, students will learn what forecasting is, as well as the different ways of illustrating the results of a forecast. Special mention will be made of optimization problems, focusing on how to formulate a problem and seek possible solutions, using Excel Solver. Finally, students will learn how to assess the results, focusing on optimal conclusions for future actions. وزارة التعليم Ministry of Education 144 2024 -1446 Learning Objectives In this unit, you will learn to: > Define what predictive modeling is. > Describe the predictive modeling categories. > Understand the process of predictive modeling. > Recognize the pros and cons of predictive modeling. > Define what forecasting is. > Define the steps of forecasting. > Make a forecast in Microsoft Excel. > Understand the concept of the confidence interval. > Categorize the different forecast charts. > Define what an optimization model is. > Understand the process of optimization using Excel Solver. > Assess optimization results and determine future actions.

Predictive data modeling and forecasting
Learning Objectives: Define what predictive modeling is
Tools: Teachable Machine
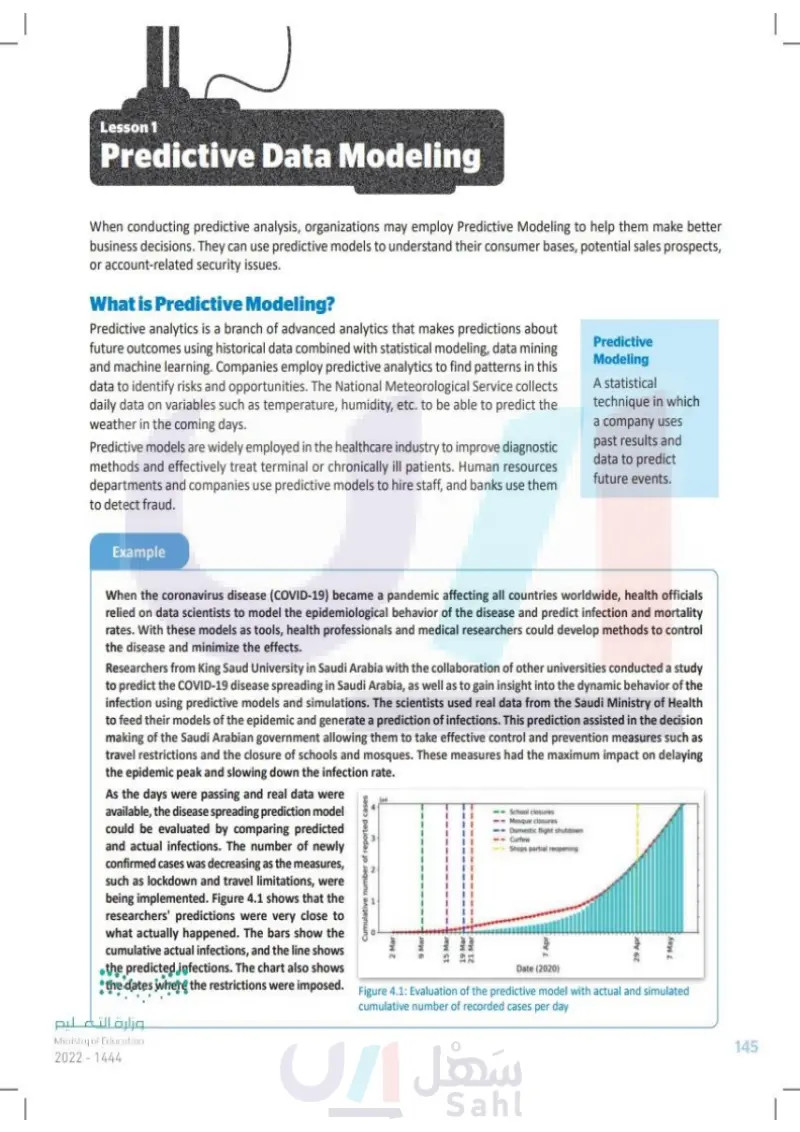
Lesson 1 Predictive Data Modeling Link to digital lesson www.ien.edu.sa When conducting predictive analysis, organizations may employ predictive modeling to help them make better business decisions. They can use predictive models to understand their consumer bases, potential sales prospects, or account-related security issues. What is Predictive Modeling? Predictive analytics is a branch of advanced analytics that makes predictions about future outcomes using historical data combined with statistical modeling, data mining and machine learning. Companies employ predictive analytics to find patterns in this data to identify risks and opportunities. The National Meteorological Service collects daily data on variables such as temperature, humidity, etc. to be able to predict the weather in the coming days. Predictive models are widely employed in the healthcare industry to improve diagnostic methods and effectively treat terminal or chronically ill patients. Human resources departments and companies use predictive models to hire staff, and banks use them to detect fraud. Predictive Modeling A statistical technique in which past results and data are used to predict future events. Example When the COVID-19 became a pandemic affecting all countries worldwide, health officials relied on data scientists to model the epidemiological behavior of the disease and predict infection and mortality rates. With these models as tools, health professionals and medical researchers could develop methods to control the disease and minimize the effects. Researchers from King Saud University in Saudi Arabia, with the collaboration of other universities, conducted a study to predict the spread of COVID-19 in Saudi Arabia, as well as to gain insight into the dynamic behavior of the infection using predictive models and simulations. The scientists used real data from the Saudi Ministry of Health to feed their models of the epidemic and generate a prediction for infections. This prediction assisted in the decision making of the Saudi Arabian government, allowing them to take effective control and prevention measures such as travel restrictions and the closure of schools and mosques. These measures had the maximum impact on delaying the epidemic peak and slowing down the infection rate. As the days were passing and real data became available, the disease spreading prediction model could be evaluated by comparing predicted and actual infections. The number of newly confirmed cases was decreasing as the measures, such as lockdown and travel limitations, were being implemented. Figure 4.1 shows that the researchers' predictions were very close to what actually happened. The bars show the cumulative actual infections, and the line shows the predicted infections. The chart also shows the dates where the restrictions were imposed. Cumulative number of reported cases 2 Mar 9 Mar 15 Mar 19 Mar 21 Mar School closures Mosque closures Domestic flight shutdown Curfew Shops partial reopening Apr Date (2020) 29 Apr 7 May Figure 4.1: Evaluation of the predictive model with actual and simulated cumulative number of recorded cases per day وزارة التعليم Ministry of Education 2024-1446 145

When the coronavirus disease (COVID-19) became a pandemic affecting all countries worldwide,
Predictive Modeling
What is Predictive Modeling?
Predictive Data Modeling
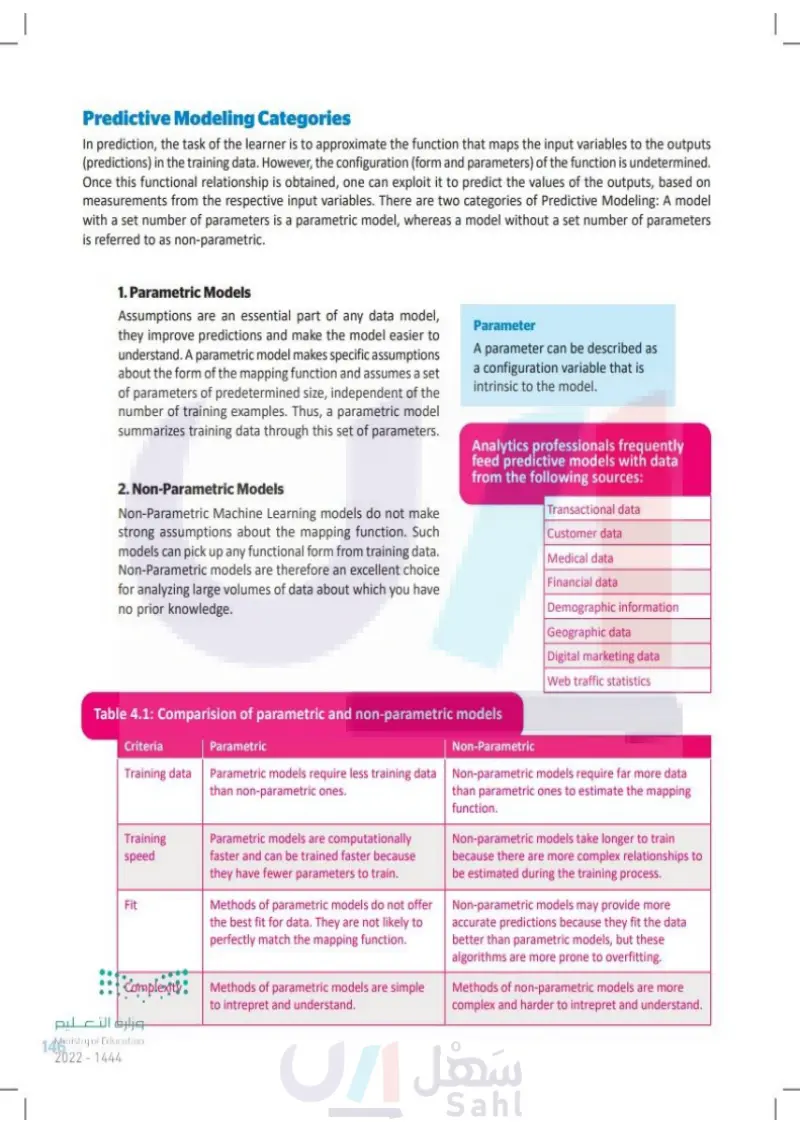
Predictive Modeling Categories In predictive modeling, the task of the learner is to approximate the function that maps the input variables to the outputs (predictions) in the training data. However, the configuration (form and parameters) of the function is undetermined. Once this functional relationship is obtained, one can exploit it to predict the values of the outputs based on measurements from the respective input variables. There are two categories of predictive modeling: a model with a set number of parameters is a parametric model, whereas a model without a set number of parameters is referred to as non-parametric. 1. Parametric Models Assumptions are an essential part of any data model, they improve predictions and make the model easier to understand. A parametric model makes specific assumptions about the form of the mapping function and assumes a set of parameters of predetermined size, independent of the number of training examples. Thus, a parametric model summarizes training data through this set of parameters. 2. Non-Parametric Models Non-Parametric Machine Learning models do not make strong assumptions about the mapping function. Such models can pick up any functional form from training data. Non-Parametric models are therefore an excellent choice for analyzing large volumes of data about which you have no prior knowledge. Parameter A parameter can be described as a configuration variable that is intrinsic to the model. Analytics professionals frequently feed predictive models with data from the following sources: Table 4.1: Comparision of parametric and non-parametric models Criteria Training data Training speed Fit Complexity Parametric Parametric models require less training data than non-parametric ones. Parametric models are computationally faster and can be trained faster because they have fewer parameters to train. Methods of parametric models do not offer the best fit for data. They are not likely to perfectly match the mapping function. Methods of parametric models are simple to interpret and understand. Non-Parametric Transactional data Customer data Medical data Financial data Demographic information. Geographic data Digital marketing data Web traffic statistics Non-parametric models require far more data than parametric ones to estimate the mapping function. Non-parametric models take longer to train because there are more complex relationships to be estimated during the training process. Non-parametric models may provide more accurate predictions because they fit the data better than parametric models, but these algorithms are more prone to overfitting. Methods of non-parametric models are more complex and harder to interpret and understand. وزارة التعليم Ministry of Education 146 2024-1446

Analytics professionals frequently feed predictive models with data from the following sources:
Parameter
Parametric Models
Non-Parametric Models
Comparision of parametric and non-parametric models
Predictive Modeling Categories
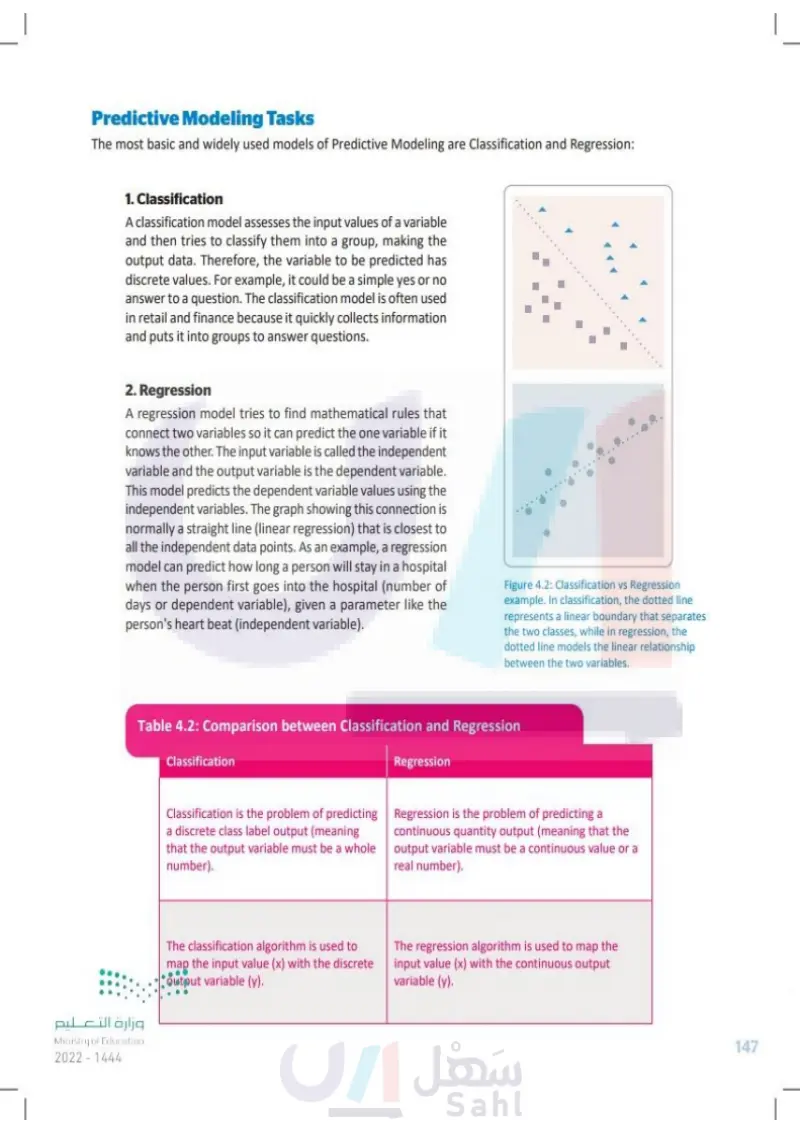
Predictive Modeling Tasks The most basic and widely used models for predictive modeling are classification and regression: 1. Classification A classification model assesses the input values of a variable and then tries to classify them into a group, making the output data. Therefore, the variable to be predicted has discrete values. For example, it could be a simple yes or no answer to a question. The classification model is often used in retail and finance because it quickly collects information and puts it into groups to answer questions. 2. Regression A regression model tries to find mathematical rules that connect two variables so it can predict one variable if it knows the other. The input variable is called the independent variable and the output variable is the dependent variable. This model predicts the dependent variable values using the independent variables. The graph showing this connection is normally a straight line (linear regression) that is closest to all the independent data points. As an example, a regression model can predict how long a person will stay in a hospital when the person first goes into the hospital (number of days or dependent variable), given a parameter like the person's heart rate (independent variable). Figure 4.2: Classification vs regression example. In classification, the dotted line represents a linear boundary that separates the two classes, while in regression, the dotted line models the linear relationship between the two variables. Table 4.2: Comparison between Classification and Regression Classification Regression وزارة التعليم Ministry of Education 2024-1446 Classification is the problem of predicting a discrete class label output (meaning that the output variable must be a whole number). Regression is the problem of predicting a continuous output (meaning that the output variable must be a continuous value or a real number). The classification algorithm is used to map the input value (x) with the discrete output variable (y). The regression algorithm is used to map the input value (x) with the continuous output variable (y). 147

Comparison between Classification and Regression
Classification vs Regression example. In classification, the dotted line represents a linear boundary that separates the two classes, while in regression, the dotted line models the linear re
Regression
Classification
Predictive Modeling Tasks
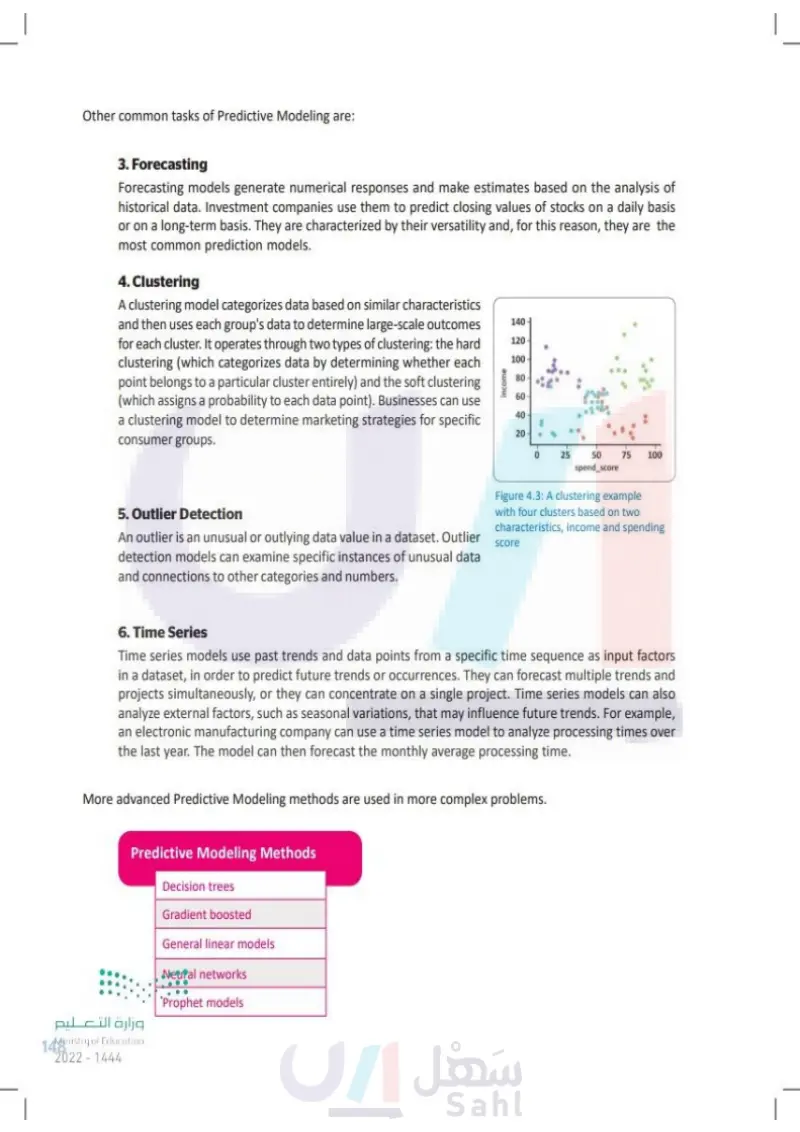
Other common tasks for predictive modeling are: 3. Forecasting Forecasting models generate numerical responses and make estimates based on the analysis of historical data. Investment companies use them to predict closing values of stocks on a daily basis or on a long-term basis. They are characterized by their versatility and, for this reason, they are the most common prediction models. 4. Clustering A clustering model categorizes data based on similar characteristics and then uses each group's data to determine large-scale outcomes for each cluster. It operates through two types of clustering: hard clustering (which categorizes data by determining whether each point belongs to a particular cluster entirely) and soft clustering (which assigns a probability to each data point). Businesses can use a clustering model to determine marketing strategies for specific consumer groups. income 140 120 100 80 60 40 20 0 25 50 75 100 spend_score 5. Outlier Detection An outlier is an unusual or outlying data value in a dataset. Outlier detection models can examine specific instances of unusual data and connections to other categories and numbers. Figure 4.3: A clustering example with four clusters based on two characteristics, income and spending score 6. Time Series Time series models use past trends and data points from a specific time sequence as input factors in a dataset, in order to predict future trends or occurrences. They can forecast multiple trends and projects simultaneously, or they can concentrate on a single project. Time series models can also analyze external factors, such as seasonal variations, that may influence future trends. For example, an electronic manufacturing company can use a time series model to analyze processing times over the last year. The model can then forecast the monthly average processing time. More advanced predictive modeling methods are used in more complex problems. Predictive Modeling Methods Decision trees Gradient boosted General linear models Neural networks Prophet models وزارة التعليم Ministry of Education 148 2024-1446

Predictive Modeling Methods
More advanced Predictive Modeling methods are used in more complex problems.
Time Series
Outlier Detection
A clustering example with four clusters based on two characteristics, income and spending score
Clustering
Forecasting
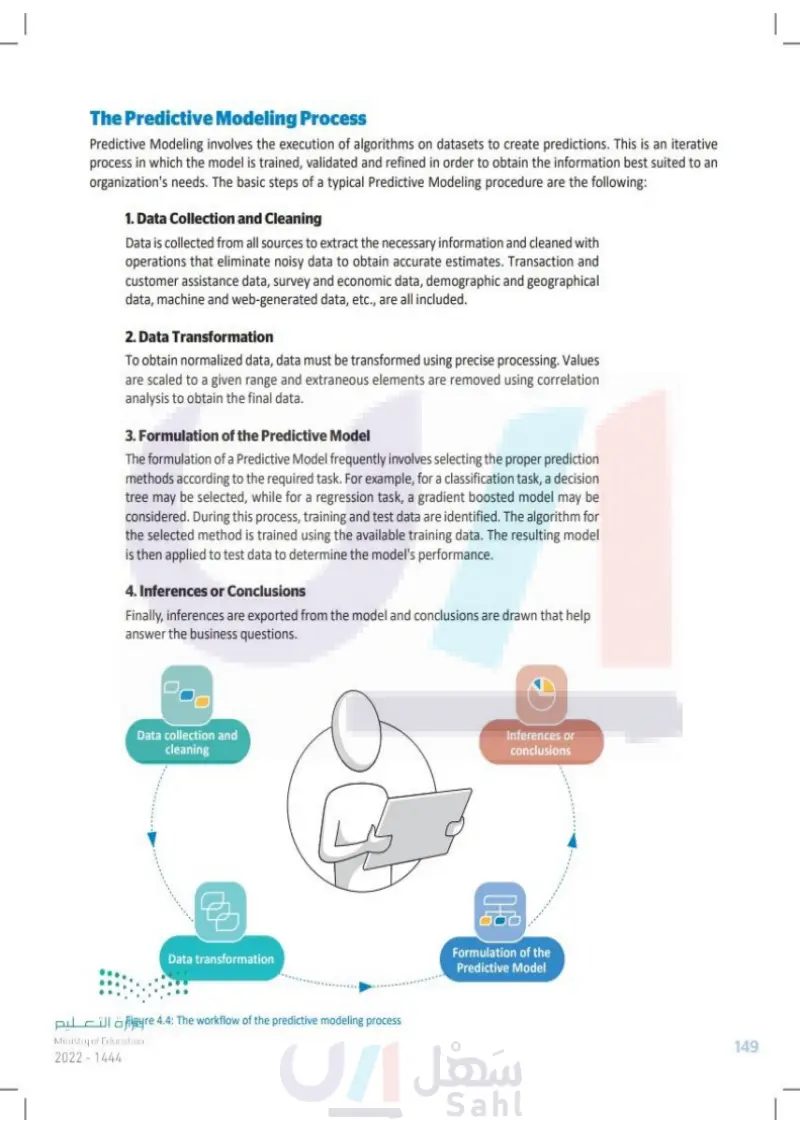
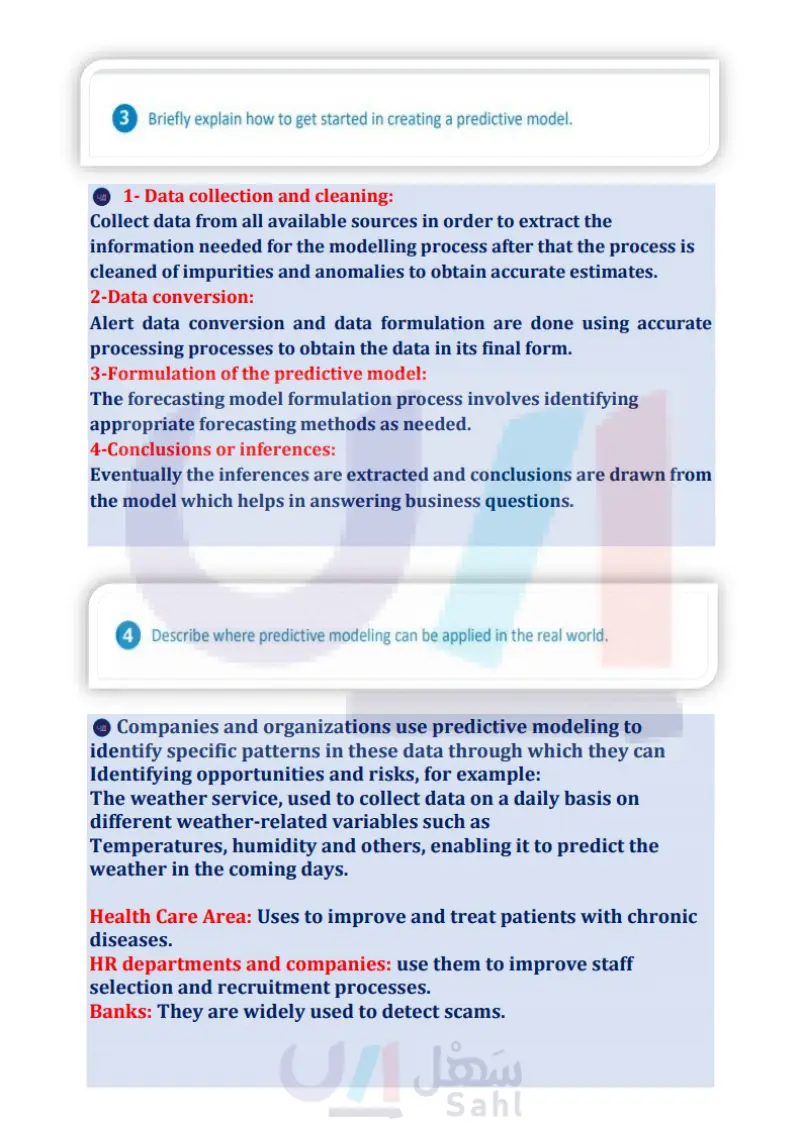
The Predictive Modeling Process Predictive modeling involves the execution of algorithms on datasets to create predictions. This is an iterative process in which the model is trained, validated and refined in order to obtain the information best suited to an organization's needs. The basic steps of a typical predictive modeling procedure are the following: 1. Data Collection and Cleaning Data is collected from all sources to extract the necessary information and cleaned with operations that eliminate noisy data to obtain accurate estimates. Transaction and customer assistance data, survey and economic data, demographic and geographical data, machine and web-generated data, etc., are all included. 2. Data Transformation To obtain normalized data, data must be transformed using precise processing. Values are scaled to a given range and extraneous elements are removed using correlation analysis to obtain the final data. 3. Formulation of the Predictive Model The formulation of a predictive model frequently involves selecting the proper prediction methods according to the required task. For example, for a classification task, a decision tree may be selected, while for a regression task, a gradient boosted model may be considered. During this process, training and test data are identified. The algorithm for the selected method is trained using the available training data. The resulting model is then applied to test data to determine the model's performance. 4. Inferences or Conclusions Finally, inferences are exported from the model and conclusions are drawn that help answer the business' questions. Data collection and cleaning وزارة التعليم Ministry of Education 2024-1446 Data transformation Inferences or conclusions Formulation of the Predictive Model Figure 4.4: The workflow of the predictive modeling process 149

Data Transformation
The workflow of the predictive modeling process
Inferences or Conclusions
Formulation of the Predictive Model
Data Collection and Cleaning
The Predictive Modeling Process
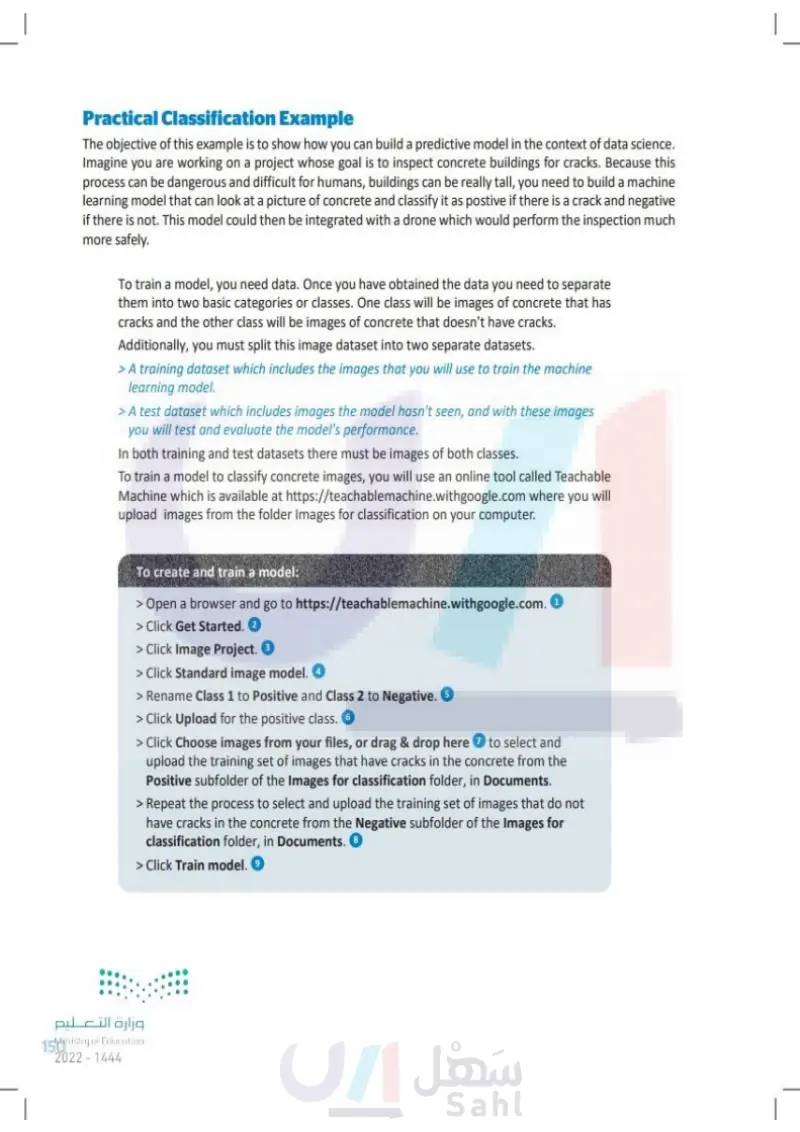
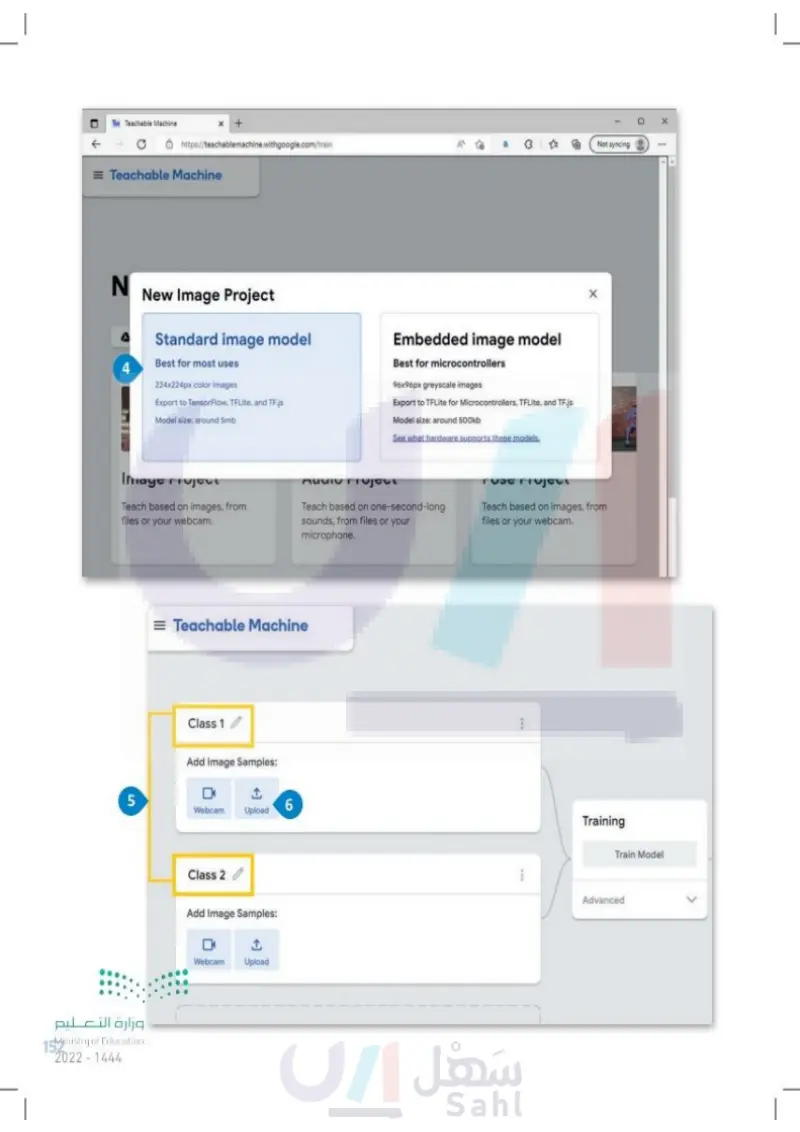
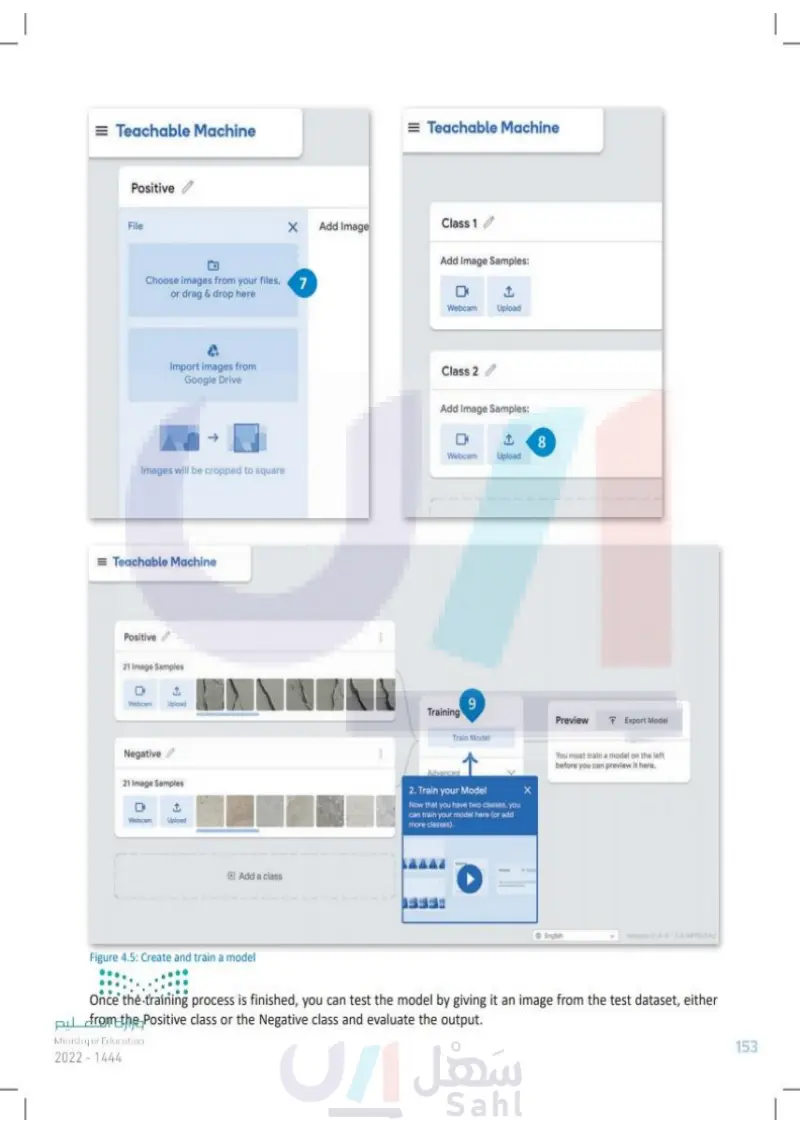
Practical Classification Example The objective of this example is to show how you can build a predictive model in the context of data science. Imagine you are working on a project whose goal is to inspect concrete buildings for cracks. Because this process can be dangerous and difficult for humans-buildings can be very tall-you need to build a machine learning model that can look at a picture of concrete and classify it as positive if there is a crack and negative if there is not. This model could then be integrated with a drone which would perform the inspection much more safely. To train a model, you need data. Once you have obtained the data, you need to separate them into two basic categories or classes. One class will be images of concrete that has cracks and the other class will be images of concrete that doesn't have cracks. Additionally, you must split this image dataset into two separate datasets. > A training dataset which includes the images that you will use to train the machine learning model. > A test dataset which includes images the model hasn't seen, and which you will use to test and evaluate the model's performance. In both training and test datasets there must be images of both classes. To train a model to classify concrete images, you will use an online tool called Teachable Machine which is available at https://teachable machine.withgoogle.com where you will upload images from the folder "Images for classification" on your computer. To create and train a model: > Open a browser and go to https://teachable machine.withgoogle.com. 1 > Click Get Started. 2) > Click Image Project. 3 > Click Standard image model. 4 > Rename Class 1 to Positive and Class 2 to Negative. 5 > Click Upload for the positive class. 6 > Click Choose images from your files, or drag & drop here ⑦ to select and upload the training images that have cracks in the concrete from the Positive subfolder of the Images for classification folder, in Documents. > Repeat the process to select and upload the training images that do not have cracks in the concrete from the Negative subfolder of the Images for classification folder, in Documents. 8 > Click Train model. 9 وزارة التعليم Ministry of Education 150 2024-1446

To create and train a model
Practical Classification Example
↑ O TM Teachable Machine * + https://teachablemachine.withgoogle.com 1 Teachable Machine Train a computer to recognize your own images, sounds, & poses. A fast, easy way to create machine learning models for your sites, apps, and more - no expertise or coding required. Get Started 2 mlo ps Coral node 8 AADUINO TM Teachable Machine ← + https://teachable machine.withgoogle.com/train =Teachable Machine New Project Open an existing project from Drive. Open an existing project from a file. Not syncing About FAQ Get Started Snap Clap 27% 65% B Not syncing Image Project Teach based on images, from files or your webcam. Audio Project Teach based on one-second-long sounds, from files or your microphone. Pose Project Teach based on images, from files or your webcam. وزارة التعليم Ministry of Education 2024-1446 3 English release-2-4-4-2.4.4#95c54c 151

Teachable Machine
↓ TM Teachable Machine C https://teachable machine.withgoogle.com/train = Teachable Machine N 4 Not syncing New Image Project Standard image model Best for most uses 224x224px color images Export to TensorFlow, TFLite, and TF.js Model size: around 5mb Embedded image model Best for microcontrollers 96x96px greyscale images Export to TFLite for Microcontrollers. TFLite, and TF.js Model size: around 500kb See what hardware supports these models. Image Project Teach based on images, from files or your webcam. Teach based on one-second-long sounds, from files or your microphone. Fuse Project Teach based on images, from files or your webcam. =Teachable Machine Class 1 Add Image Samples: 0 1 LO 5 6 Webcam Upload وزارة التعليم Ministry of Education 152 2024-1446 Class 2 Add Image Samples: ↑ Webcam Upload 2 4 Training Train Model Advanced

New Image Project
= Teachable Machine Positive File Choose images from your files, 7 or drag & drop here Import images from Google Drive -> Images will be cropped to square =Teachable Machine Positive 21 Image Samples 1 Webcam Upload Negative 21 Image Samples 0 1 Webcam Upload Add a class = Teachable Machine Add Image Class 1 Add Image Samples: Webcam Upload Class 2 Add Image Samples: 8 Webcam Upload Training 9 Preview Export Model Train Model You must train a model on the left before you can preview it here. Advanced 2. Train your Model Now that you have two classes, you can train your model here (or add more classes). Figure 4.5: Create and train a model English release-2-4-4-2.4.495c540 Once the training process is finished, you can test the model by giving it an image from the test dataset, either from the Positive class or the Negative class, and evaluate the output. Ministry of Education 2024-1446 153

Once the training process is finished, you can test the model by giving it an image from the test dataset, either from the Positive class or the Negative class and evaluate the output
Teachable Machine
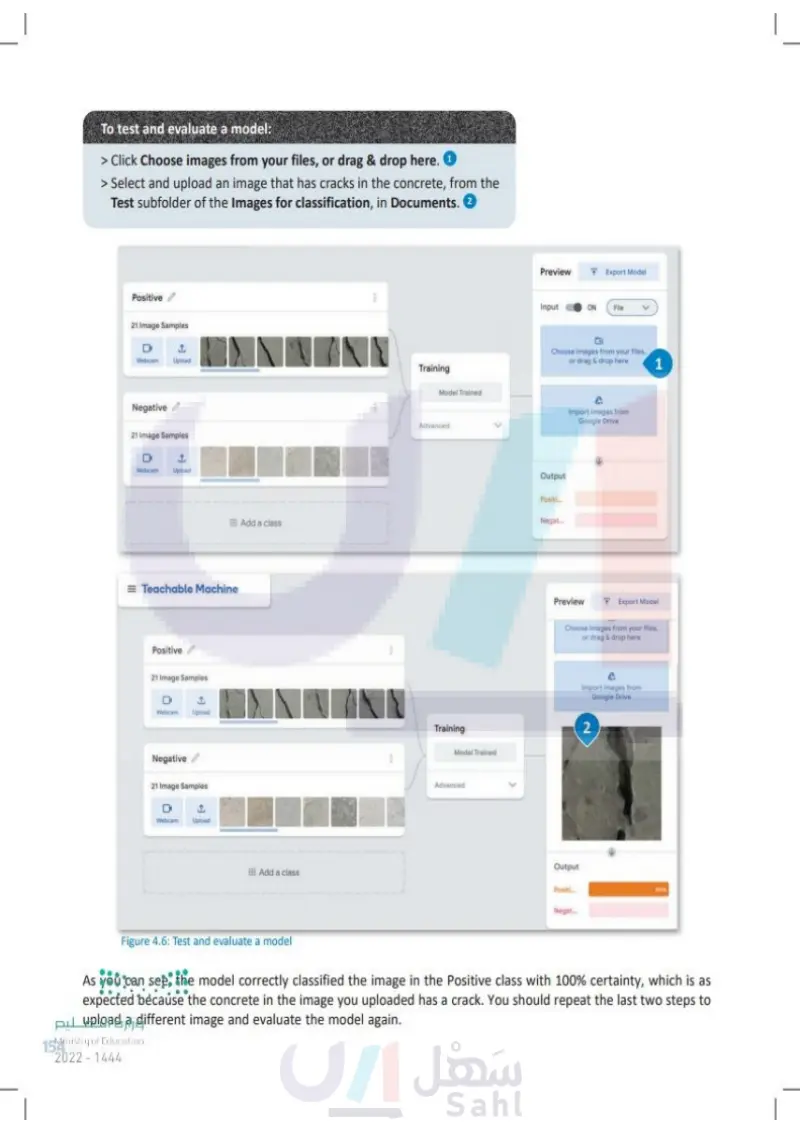
To test and evaluate a model: > Click Choose images from your files, or drag & drop here. > Select and upload an image that has cracks in the concrete, from the Test subfolder of the Images for classification, in Documents. 2 Positive 21 Image Samples 0 Webcam Upload Training Model Trained Negative 21 Image Samples Webcam Upload = Teachable Machine Positive 21 Image Samples Webcam Add a class Advanced Preview + Export Model Input ON File Choose images from your files. Output Positi Neget or drag & drop here Import images from Google Drive Preview Export Model Choose images from your files, or drag & drop here Model Trained Import images from Google Drive 2 Upload Training Negative 21 Image Samples 0 Webcam Upload Add a class Advanced Output Pall Negat 1 Figure 4.6: Test and evaluate a model As you can see, the model correctly classified the image in the Positive class with 100% certainty, which is as expected because the concrete in the image you uploaded has a crack. You should repeat the last two steps to upload a different image and evaluate the model again. Ministry of Education 154 2024-1446

As you can see, the model correctly classified the image in the Positive class with 100% certainty
To test and evaluate a model
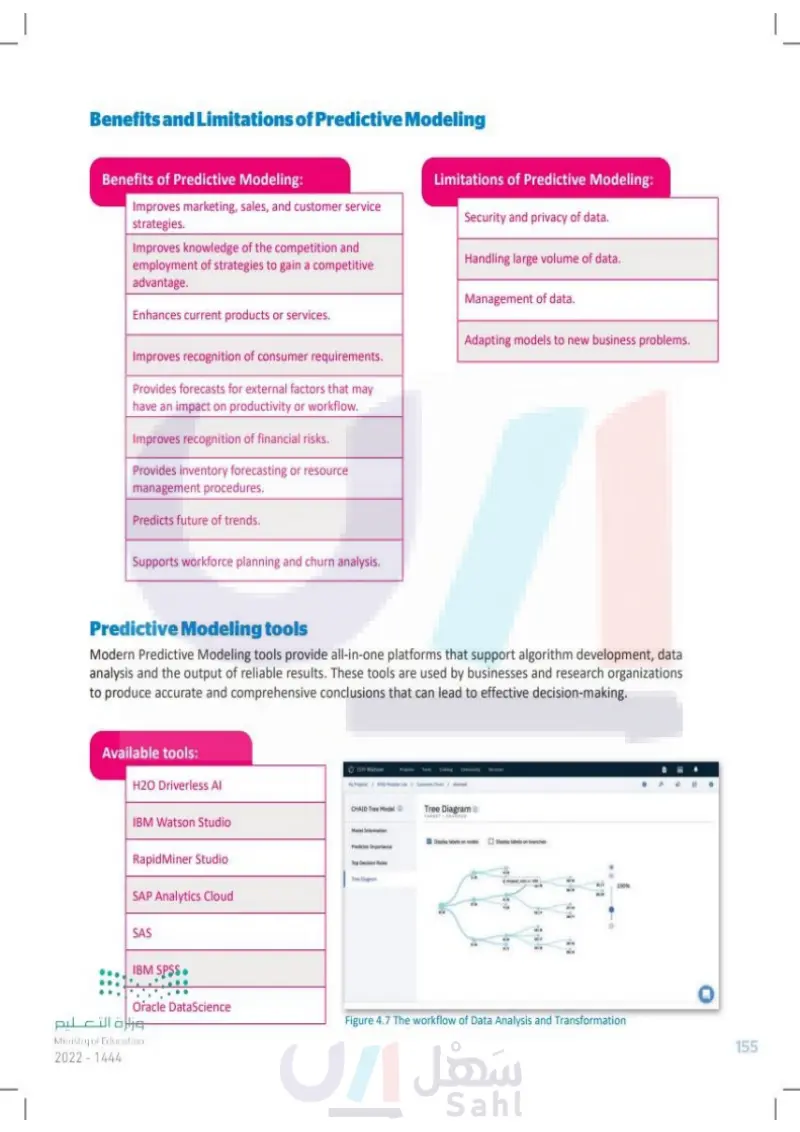
Benefits and Limitations of Predictive Modeling Benefits of Predictive Modeling: Improves marketing, sales, and customer service strategies. Improves knowledge of the competition and employment of strategies to gain a competitive advantage. Enhances current products or services. Improves recognition of consumer requirements. Provides forecasts for external factors that may have an impact on productivity or workflow. Improves recognition of financial risks. Provides inventory forecasting or resource management procedures. Predicts future trends. Limitations of Predictive Modeling: Security and privacy of data. Handling large volume of data. Management of data. Adapting models to new business problems. Supports workforce planning and churn analysis. Predictive Modeling tools Modern Predictive Modeling tools provide all-in-one platforms that support algorithm development, data analysis and the output of reliable results. These tools are used by businesses and research organizations to produce accurate and comprehensive conclusions that can lead to effective decision-making. Available tools: H20 Driverless Al IBM Watson Studio RapidMiner Studio SAP Analytics Cloud SAS IBM Watson Projects Tools Cataleg Community Services CHAID Tree Tree Model Tree Diagram Model Information Display labels on nodes Display labels on branches Predictor Importance Top Decision Rutes Tree Diagram 119 SLIT 1819 414 3319 100% IBM SPSS Oracle DataScience Figure 4.7 The Data Analysis and Transformation workflow قسة التعليم Ministry of Education 2024-1446 155

Predictive Modeling tools
Benefits and Limitations of Predictive Modeling
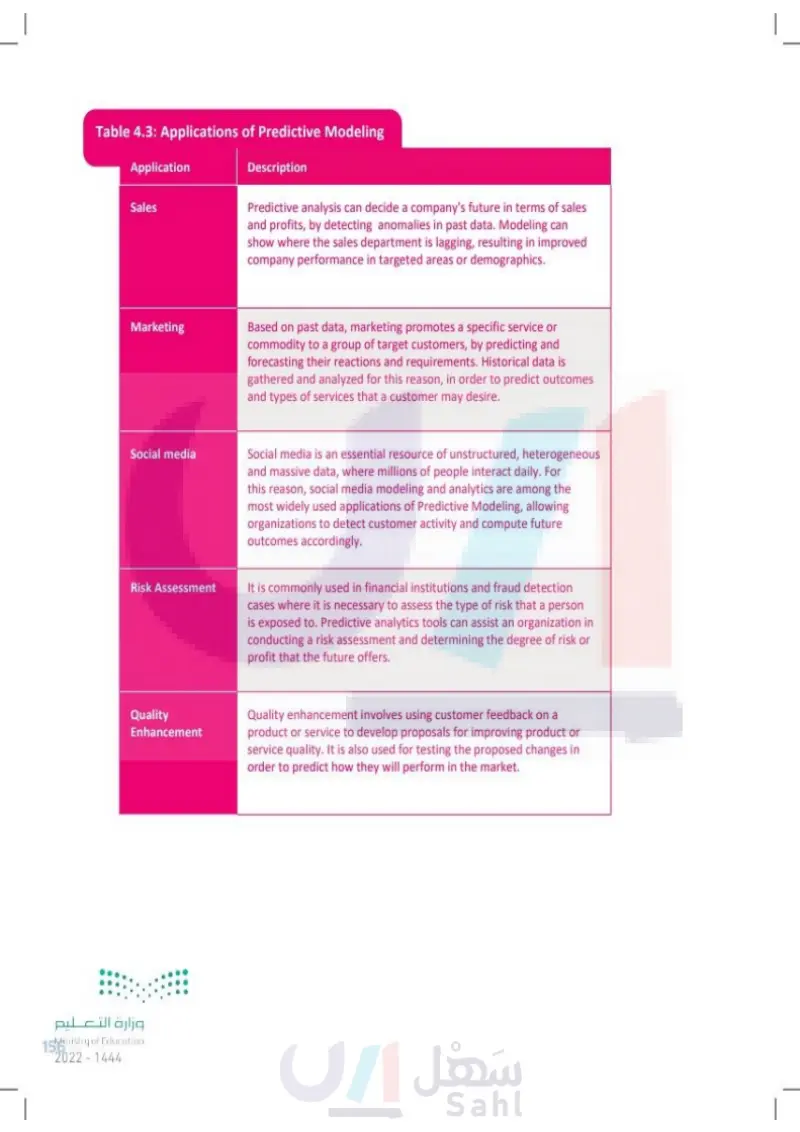
Table 4.3: Applications of Predictive Modeling Application Sales Description Predictive analysis can decide a company's future in terms of sales and profits, by detecting anomalies in past data. Modeling can show where the sales department is lagging, resulting in improved company performance in targeted areas or demographics. Marketing Based on past data, marketing promotes a specific service or commodity to a group of target customers by predicting and forecasting their reactions and requirements. Historical data is gathered and analyzed, in order to predict outcomes and types of services that a customer may desire. Social media Social media is an essential resource of unstructured, heterogeneous and massive data, where millions of people interact daily. For this reason, social media modeling and analytics are among the most widely used applications of redictive modeling, allowing organizations to detect customer activity and compute future outcomes accordingly. Risk Assessment This is commonly used in financial institutions and fraud detection cases where it is necessary to assess the type of risk that a person is exposed to. Predictive analytics tools can assist an organization in conducting a risk assessment and determining the degree of risk or potential profit. Quality Enhancement Quality enhancement involves using customer feedback on a product or service to develop proposals for improving product or service quality. It is also used for testing the proposed changes in order to predict how they will perform in the market. وزارة التعليم Ministry of Education 156 2024-1446

Applications of Predictive Modeling
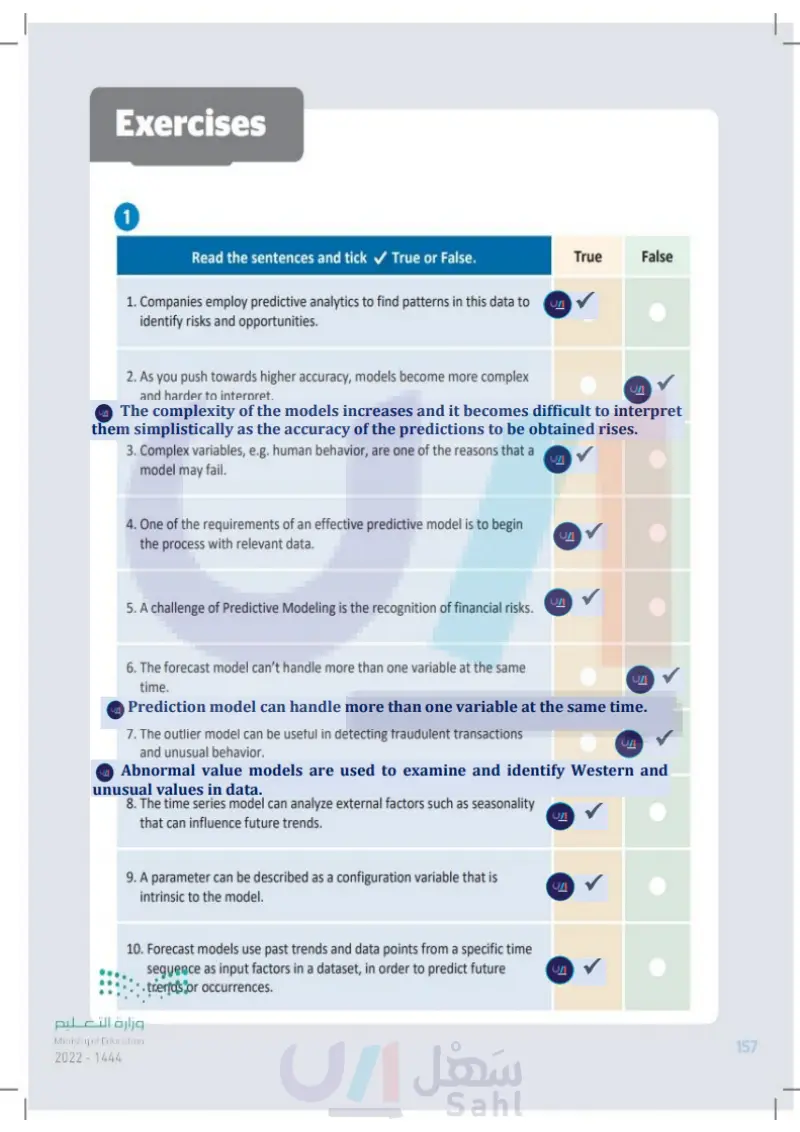
Exercises 1 Read the sentences and tick ✓ True or False. 1. Companies employ predictive analytics to find patterns in data to identify risks and opportunities. 2. As you push towards higher accuracy, models become more complex and harder to interpret. 3. Complex variables, e.g. human behavior, are one of the reasons that a model may fail. 4. One of the requirements of an effective predictive model is to begin the process with relevant data. 5. A challenge of predictive modeling is the recognition of financial risks. 6. A forecast model can't handle more than one variable at the same time. 7. An outlier model can be useful in detecting fraudulent transactions and unusual behavior. 8. A time series model can analyze external factors such as seasonality that can influence future trends. 9. A parameter can be described as a configuration variable that is intrinsic to the model. 10. Forecast models use past trends and data points from a specific time sequence as input factors in a dataset in order to predict future trends or occurrences. وزارة التعليم Ministry of Education 2024 -1446 True False 157

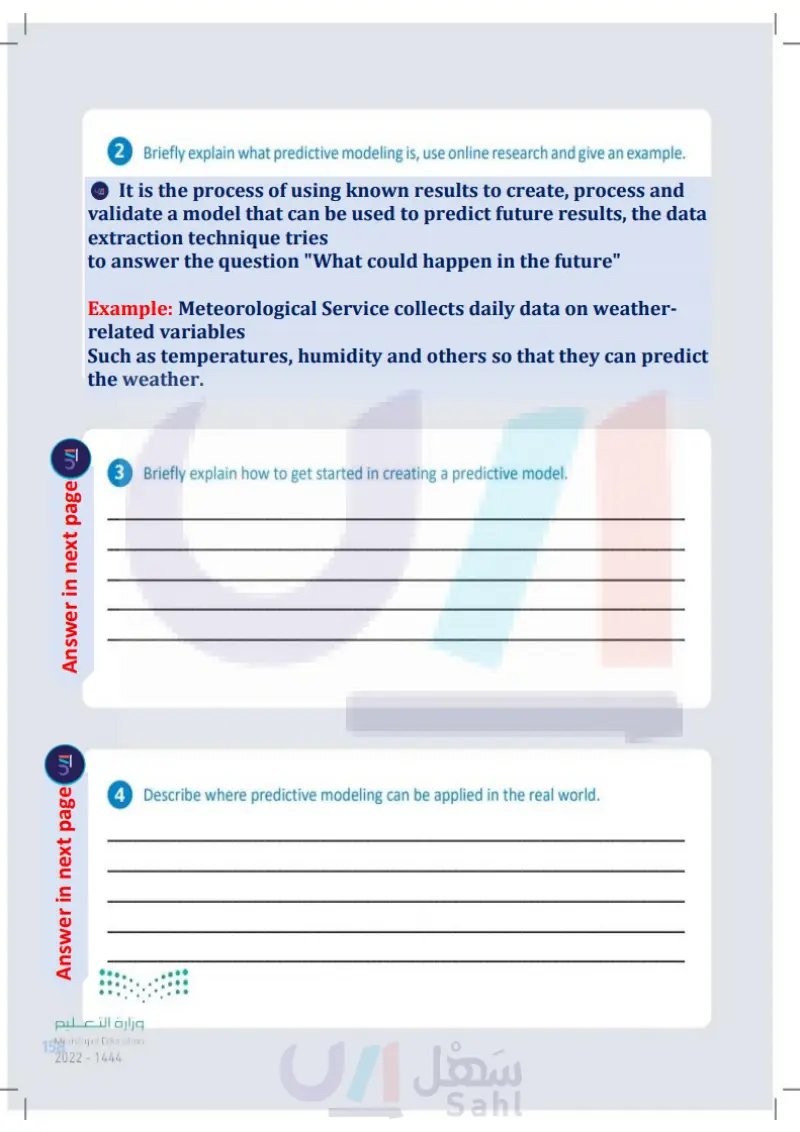
2 Briefly explain what predictive modeling is. Use online research and give an example. 3 Briefly explain how to get started in creating a predictive model. 4 Describe where predictive modeling can be applied in the real world. وزارة التعليم Ministry of Education 2024-1446

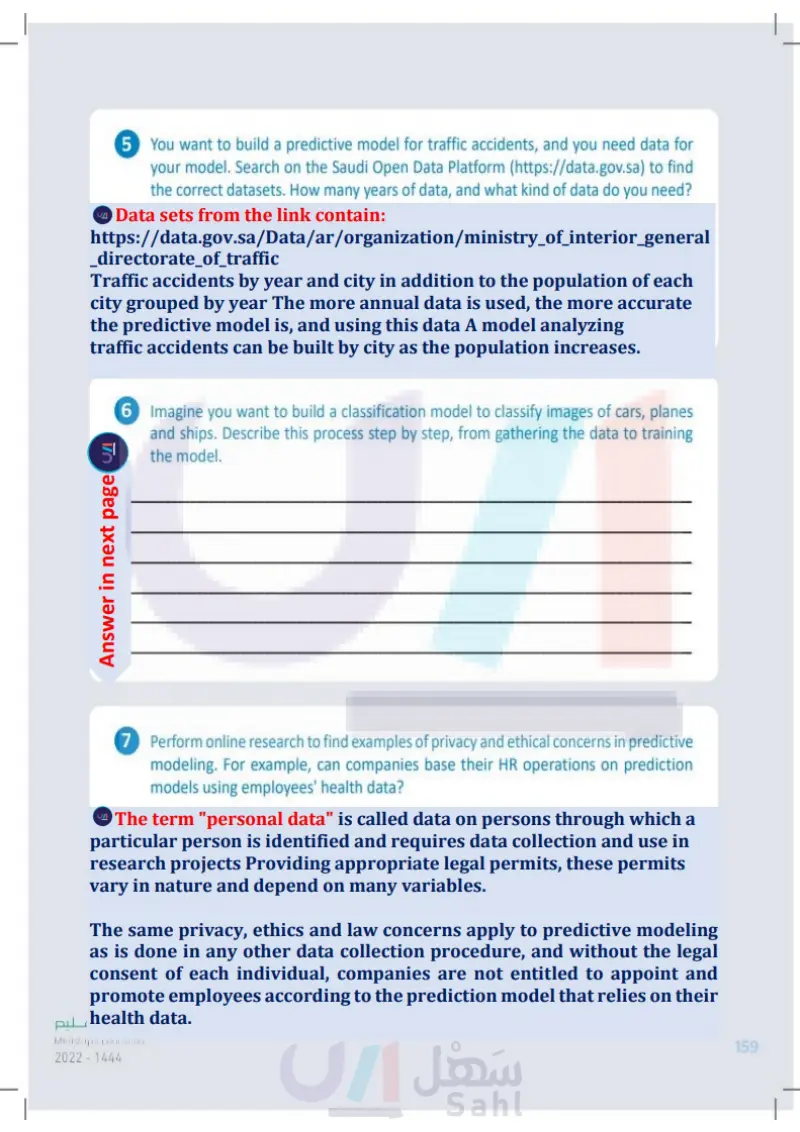
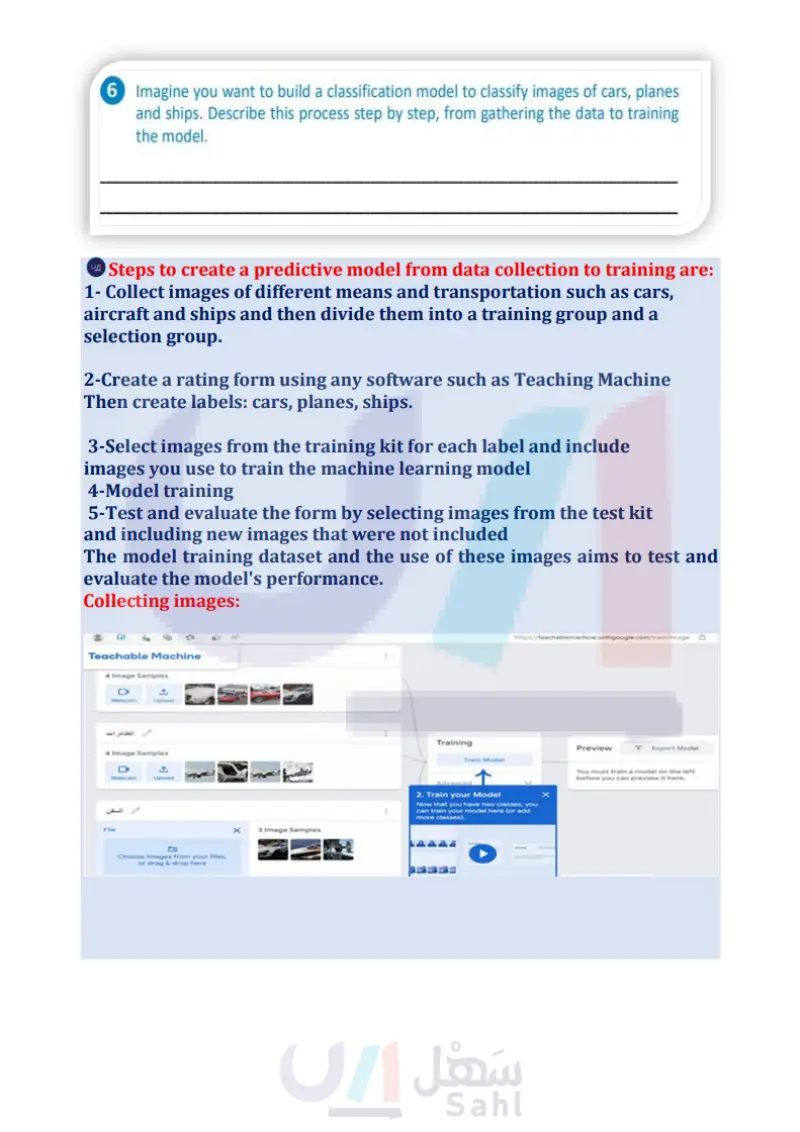
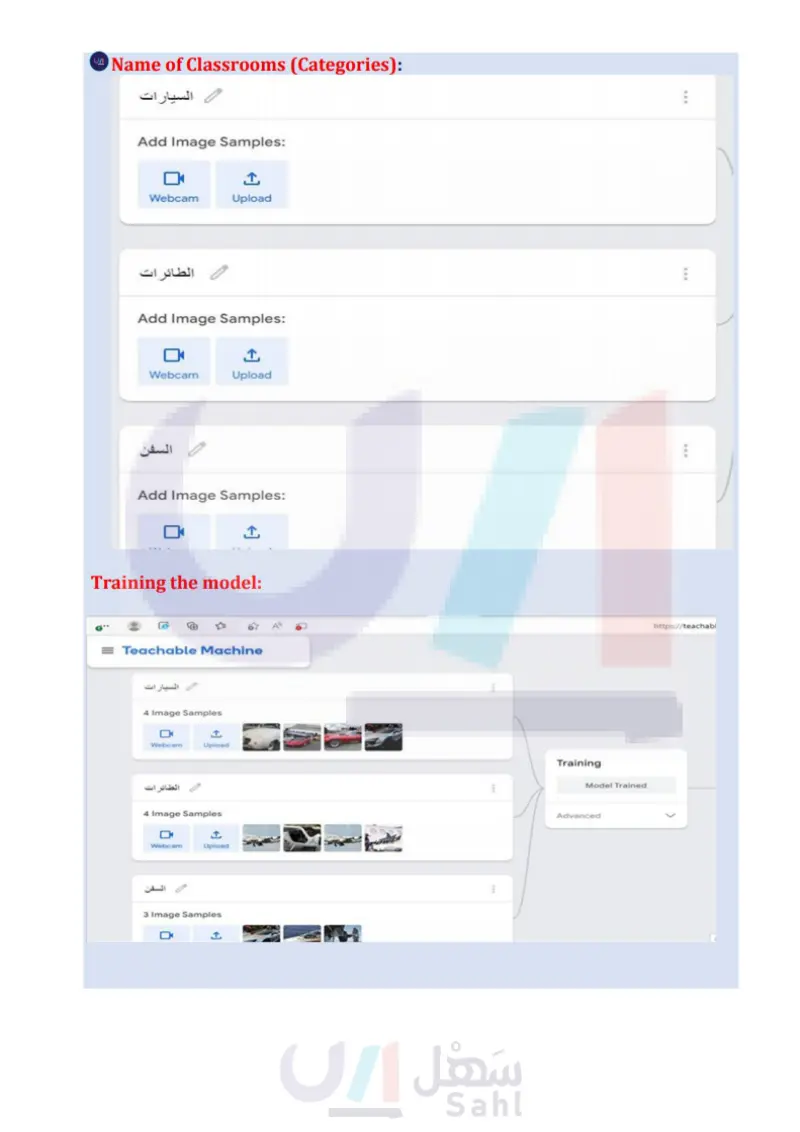
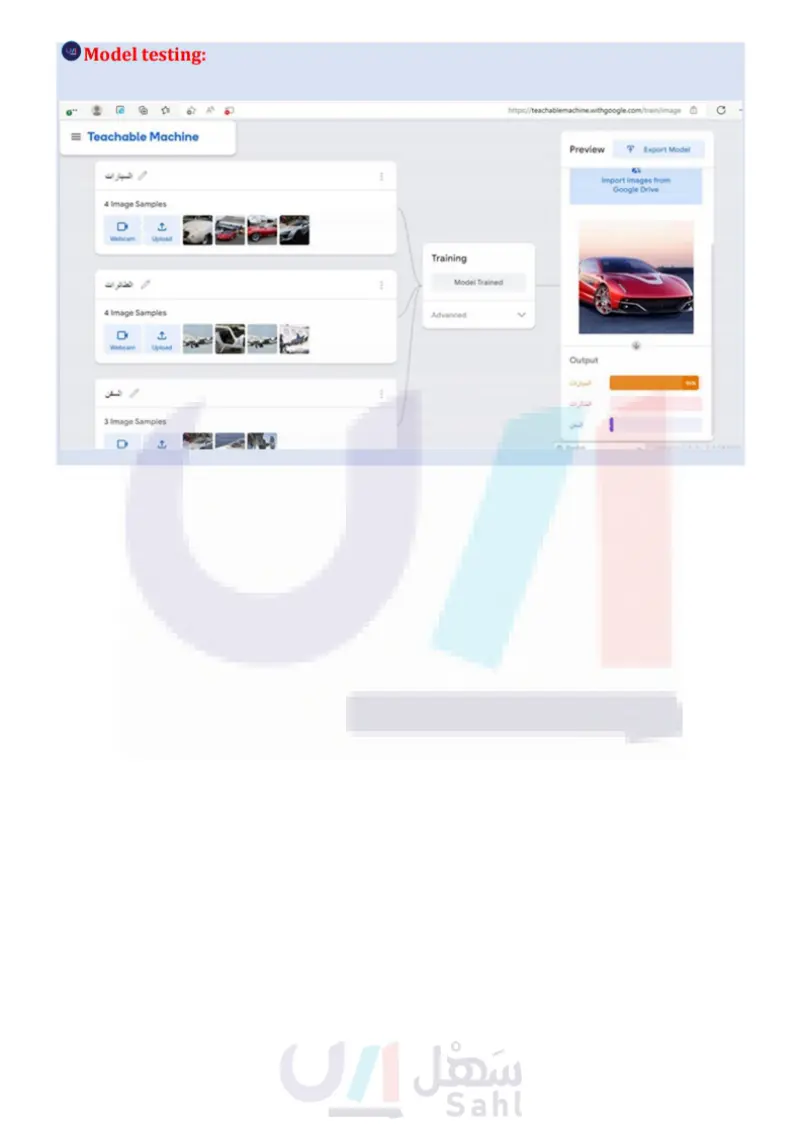
5 You want to build a predictive model for traffic accidents, and you need data for your model. Search on the Open Data Platform (https://open.data.gov.sa) to find the correct datasets. How many years of data, and what kind of data do you need? 6 Imagine you want to build a classification model to classify images of cars, planes and ships. Describe this process step by step, from gathering the data to training the model. 7 Perform online research to find examples of privacy and ethical concerns in predictive modeling. For example, can companies base their HR operations on prediction models using employees' health data? وزارة التعليم Ministry of Education 2024 -1446 159

Perform online research to find examples of privacy and ethical concerns in predictive modeling. For example, can companies base their HR operations on prediction models using employees' heal


