


Make a temperature graph - Connect Plus Primary 2 Term 2 - ثاني ابتدائي
Unit 7: Where is it from
Unit 8: Don't getlost
Unit 9: Along the Nile
Unit 10: At the supermarket
Unit 11: let's sing
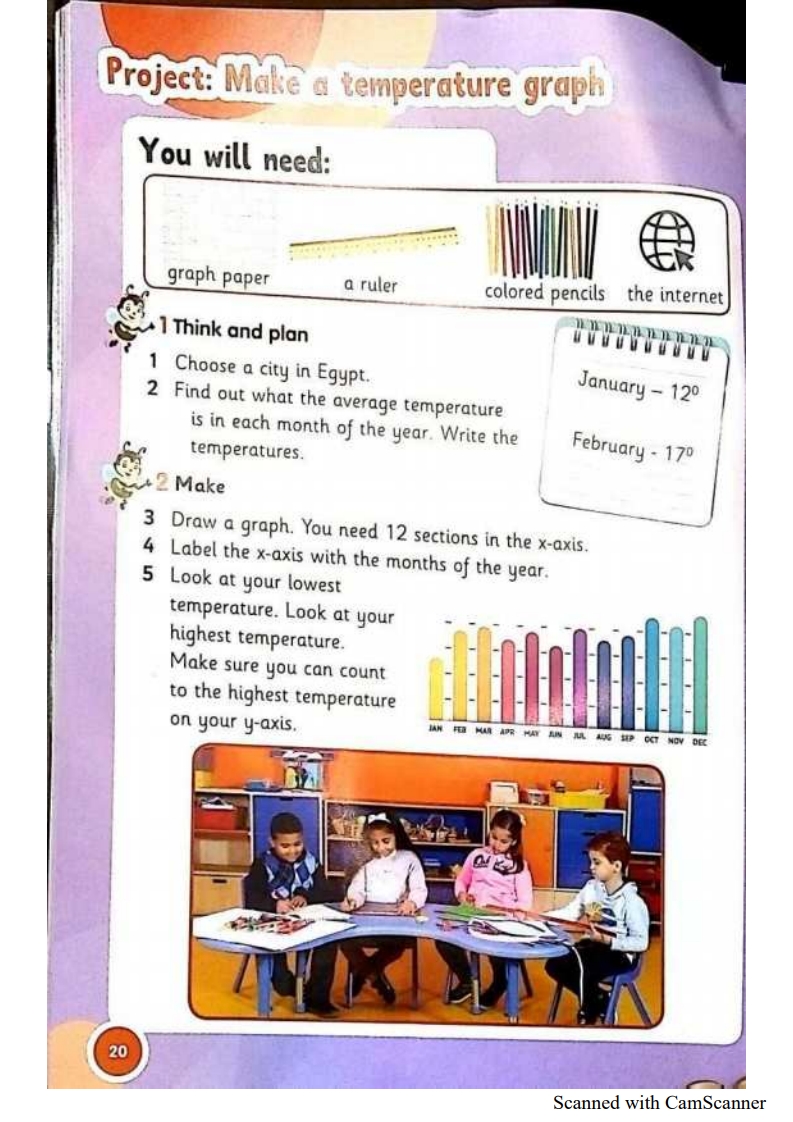
Project: Make a temperature graph You will need: 1 Think and plan graph paper a ruler colored pencils the internet January - 12° February - 17º 1 Choose a city in Egypt. 2 Find out what the average temperature is in each month of the year. Write the temperatures. 2 Make 3 Draw a graph. You need 12 sections in the x-axis. 4 Label the x-axis with the months of the year. 5 Look at your lowest temperature. Look at your highest temperature. Make sure you can count to the highest temperature on your y-axis. JAN FEB MAR APR MAY AN AUG SEP OCT NOV DEC 20 Scanned with CamScanner
you will need

make

