


Connect Plus Primary 2 Term 2 Activity Book
Unit 7: Where is it from
Project: Make a temperature graph
Make a temperature graph - Connect Plus Primary 2 Term 2 Activity Book - ثاني ابتدائي
Unit 7: Where is it from
Unit 8: Don't getlost
Unit 9: Along the Nile
Unit 10: At the supermarket
Unit 11: let's sing
Unit 12: Say that again
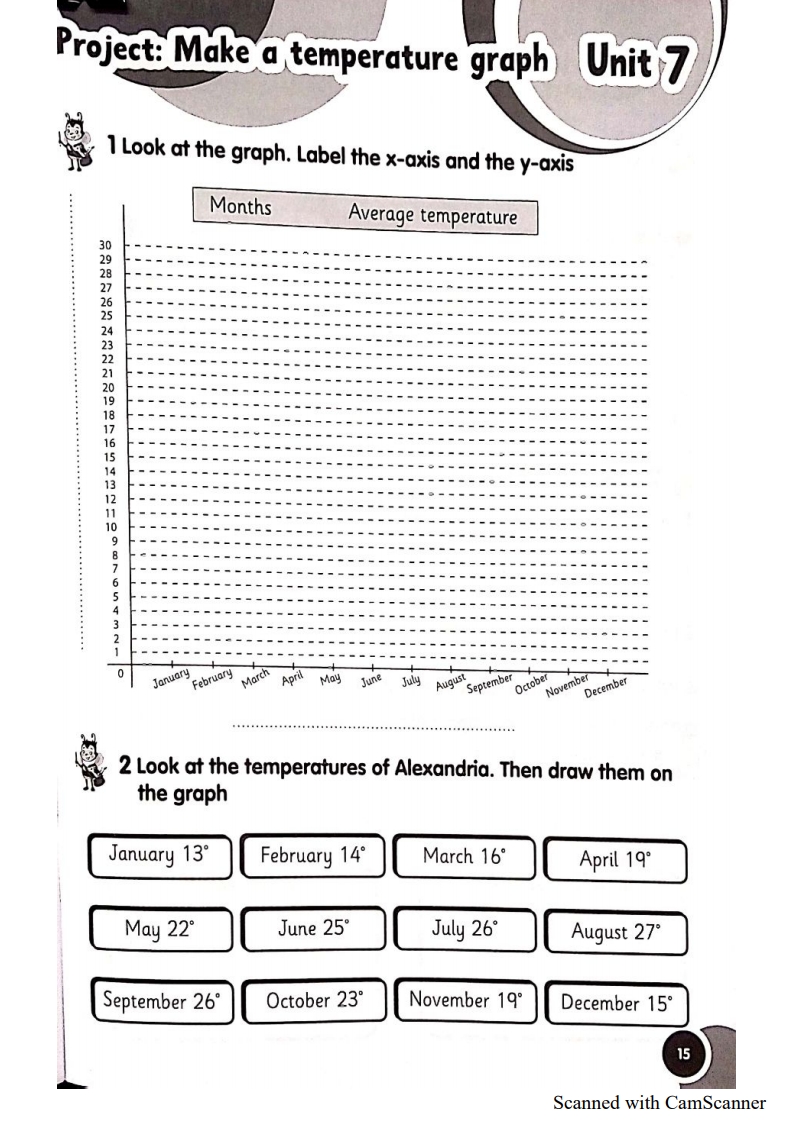
Project: Make a temperature graph Unit 7 1 Look at the graph. Label the x-axis and the y-axis Months Average temperature January February March April May June July August September October November December 2 Look at the temperatures of Alexandria. Then draw them on the graph January 13° February 14° March 16° April 19° May 22° June 25° July 26° August 27° September 26° October 23° November 19° December 15° 15 Scanned with CamScanner
look at the graphs

look at the temperatures of Alexandria.then draw them on the graphs

